Download
1 / 4
40 likes | 54 Views
West Virginia High School Survey. Summary Graphs. Number of students in a class of 30 who:. Sometimes, most of the time, or always wore a seatbelt when riding in a car. 25.4. Did not ride with a driver who had been drinking alcohol during the past 30 days. 22.6.

E N D
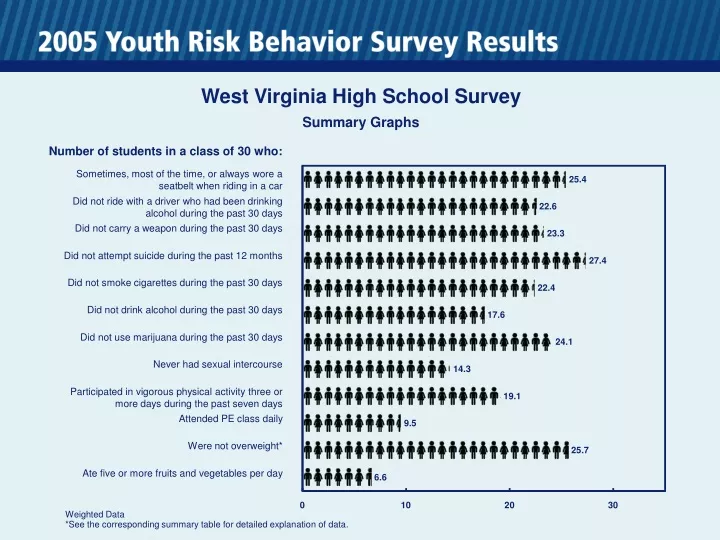
West Virginia High School Survey Summary Graphs Number of students in a class of 30 who: Sometimes, most of the time, or always wore a seatbelt when riding in a car 25.4 Did not ride with a driver who had been drinking alcohol during the past 30 days 22.6 Did not carry a weapon during the past 30 days 23.3 Did not attempt suicide during the past 12 months 27.4 Did not smoke cigarettes during the past 30 days 22.4 Did not drink alcohol during the past 30 days 17.6 Did not use marijuana during the past 30 days 24.1 Never had sexual intercourse 14.3 Participated in vigorous physical activity three or more days during the past seven days 19.1 Attended PE class daily 9.5 Were not overweight* 25.7 Ate five or more fruits and vegetables per day 6.6 0 10 20 30 Weighted Data *See the corresponding summary table for detailed explanation of data.
West Virginia High School Survey Summary Graphs Number of students in a class of 30 who: Never or rarely wore a seatbelt when riding in a car 4.6 Rode with a driver who had been drinking alcohol during the past 30 days 7.4 Carried a weapon during the past 30 days 6.7 Attempted suicide during the past 12 months 2.6 Smoked cigarettes during the past 30 days 7.6 Drank alcohol during the past 30 days 12.5 Used marijuana during the past 30 days 5.9 Ever had sexual intercourse 15.8 Did not participate in vigorous physical activity three or more days during the past seven days 10.9 Did not attend PE class daily 20.5 Were overweight* 4.4 Did not eat five or more fruits and vegetables per day 23.4 0 10 20 30 Weighted Data *See the corresponding summary table for detailed explanation of data.
West Virginia High School Survey Summary Graphs Percentage of students who: Sometimes, most of the time, or always wore a seatbelt when riding in a car 84.8 Did not ride with a driver who had been drinking alcohol during the past 30 days 75.2 Did not carry a weapon during the past 30 days 77.7 Did not attempt suicide during the past 12 months 91.2 Did not smoke cigarettes during the past 30 days 74.7 Did not drink alcohol during the past 30 days 58.5 Did not use marijuana during the past 30 days 80.4 Never had sexual intercourse 47.5 Participated in vigorous physical activity three or more days during the past seven days 63.7 Attended PE class daily 31.7 Were not overweight* 85.5 Ate five or more fruits and vegetables per day 22.1 0 20 40 60 80 100 Weighted Data *See the corresponding summary table for detailed explanation of data.
West Virginia High School Survey Summary Graphs Percentage of students who: Never or rarely wore a seatbelt when riding in a car 15.2 Rode with a driver who had been drinking alcohol during the past 30 days 24.8 Carried a weapon during the past 30 days 22.3 Attempted suicide during the past 12 months 8.8 Smoked cigarettes during the past 30 days 25.3 Drank alcohol during the past 30 days 41.5 Used marijuana during the past 30 days 19.6 Ever had sexual intercourse 52.5 Did not participate in vigorous physical activity three or more days during the past seven days 36.3 Did not attend PE class daily 68.3 Were overweight* 14.5 Did not eat five or more fruits and vegetables per day 77.9 0 20 40 60 80 100 Weighted Data *See the corresponding summary table for detailed explanation of data.

![Reproduction 6.6 ;]](https://cdn1.slideserve.com/2046284/reproduction-6-6-dt.jpg)