Download
1 / 11
110 likes | 182 Views
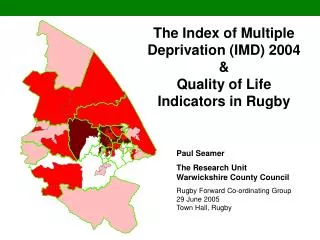
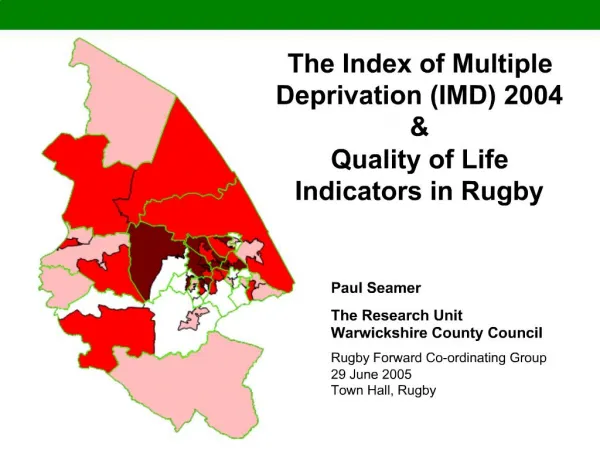
Interpreting the Scottish Index of Multiple Deprivation 2009. Presentation to SCOTSTAT Small Area Statistics event, 5 th October 2010 James Arnott Development & Regeneration Services Glasgow City Council. Scottish Government Analysis. Improvements in Glasgow

E N D
Interpreting the Scottish Index of Multiple Deprivation 2009 Presentation to SCOTSTAT Small Area Statistics event, 5th October 2010 James Arnott Development & Regeneration Services Glasgow City Council
Scottish Government Analysis • Improvements in Glasgow • Concentrations of multiple deprivation becoming more spread out geographically • Concentrations of deprivation in the most deprived datazones reduced slightly • Most datazones moving out of 15% 2004-06 remained out in 09 • Most datazones in 15% in 09 also in 15% in 04 & 06
Further Development of Analysis Identification of other categories • 1%-5% persistent deprivation • Moving out of the 1% to 15% category • From the 16%-50% to 51%-100% categories • Large moves within categories
Issues Arising • Drivers of change • Areas of persistent deprivation • Displacement • Increasing inequalities: within the 1%-15% category; between the 1%-15% and 16%-100% • Which policy to reduce deprivation
Caveats • Measure of deprivation not overall prosperity: increasingly measures absence not presence • Possibility of exaggerating the significance of small reductions in deprivation • Difference between datazone boundaries and natural communities
Outcomes • Ability of the city to maintain reductions in deprivation • Designing a suitable approach towards monitoring • Turning the focus towards specific communities
Next Steps • Weathervane areas combining deprivation with stability and improvement • Combine small area information with local knowledge to monitor trends • Use as an early indication of trends within the wider city