Download
1 / 28
280 likes | 606 Views
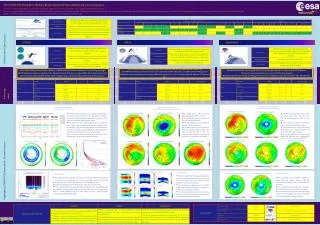
Coordinated activity for the geophysical validation of MIPAS-ENVISAT v4.61/ v4.62 Ozone data . Ugo Cortesi IFAC-CNR, Firenze, Italy. Atmospheric Science Conference 2006 ESA-ESRIN – Frascati, Italy, 8-12 May 2006. MIPAS O 3 Validation – Contributing Teams.

E N D
Coordinated activity for the geophysical validation of MIPAS-ENVISAT v4.61/ v4.62 Ozone data • Ugo Cortesi • IFAC-CNR, Firenze, Italy Atmospheric Science Conference 2006 ESA-ESRIN – Frascati, Italy, 8-12 May 2006
MIPAS O3 Validation – Contributing Teams Name Institute Country Contribution C.E. Blom IMK.FZK Germany AB T. Blumenstock and S. Mikuteit IMK-FZK Germany GB A. Bracher and M. Weber IUP-Un. Bremen Germany SI I. Boyd NIWA-ERI New Zealand GB M. Iarlori Univ. L’Aquila Italy GB K. Jucks and K. Chance SAO-CfA USA AB J. Kuttipurrath CNRS-LMD France AB J-C Lambert and C. DeClercq BIRA Belgium GB Y. Meijer RIVM The Netherlands GB F.Mencaraglia IFAC-CNR Italy AB H. Oelhaf IMK-FZK Germany AB S. Payan and C. Camy-Peyret LPMA-CNRS France AB C. Piccolo Univ. Oxford UK SI M. Pirre and V. Catoire LPCE-CNRS France AB F. Ravegnani and I. Kostadinov ISAC-CNR Italy AB G. Redaelli Univ. L’Aquila Italy MA H. Sembhi and J.J. Remedios Univ. Leicester UK GB + SI T. Steck IMK-FZK Germany SI K. Strong and T. Kerzenmacher Univ. Toronto Canada GB C. Varotsos and C. Tzanis Univ. Athens Greece GB C. Vigouroux BIRA Belgium GB A. Waterfall, J. Reburn, R. Siddans RAL UK MA + SI
MIPAS O3 coord. validation: OBJECTIVE AND STRATEGY Geophysical validation of level-2 operational O3 data obtained during MIPAS nominal spectral resolution (Ds = 0.025 cm-1) mission, from July 6th, 2002 to March 26th, 2004. Focus on off-line products from the Instrument Processing Facility versions 4.61 and 4.62 (hereafter MIPAS IPF v4.61 and v4.62 data). Merging of individual validation results provided by the GBMCD, ESABC and MASI teams and based on re-analyses sharing common criteria and tools for the inter-comparison. Update of the pre-launch estimates for precision and accuracy of MIPAS Ozone VMR vertical profiles.
Intercomparison Criteria Baseline criteria for spatial and temporal coincidence: Ds < 300 km Dt < 3 hours Additional requirement for max. PV differences ((DPV/PV)max~ 15%) to be considered for intercomparison of polar winter measurements. Reduction of vertical smoothing differences using averaging kernels and common a priori state. Recommended representation of O3 vertical profiles: volume mixing ratio versus pressure. Standard settings for calculation/ comparison of O3 partial columns. Use of trajectory calculations to increase the number of coincidences (with the same baseline collocation criteria adopted for direct coincidences).
Ground-based measurements Balloon and aircraft measurements SAGE II (IUP - Univ. Bremen) POAM III (IMK-FZK) ACE (Univ. Oxford) ODIN-SMR (Univ. Oxford) HALOE (Univ. Leicester) GOME (RAL) Balloon-borne instruments Airborne Instruments MIPAS-B (IMK-FZK) Falcon: ASUR (LMD-CNRS) IBEX (IFAC-CNR) M-55: MIPAS-STR (IMK-FZK) FIRS-2 (SAO-CfA) SAFIRE-A (IFAC-CNR) SPIRALE (LPCE-CNRS) GASCOD-A (ISAC-CNR) LPMA (LPMA-CNRS) FOZAN (ISAC-CNR) Pseudo-global comparison with O3 data from NDSC/GAW stations (BIRA) FT-IR measurements at high and midlatitude stations (BIRA) (IMK-FZK) Lidar measurements (EQUAL project) (RIVM) O3 sondes at mid-latitudes (Un L’Aquila) (Un. Athens) (Un. Toronto) Microwave radiometers and lidars at Mauna Kea and Lauder (NIWA-ERI) Satellite measurements Assimilated data ECMWF Ozone data (RAL) MIPAS O3 correlative data-sets CONTINUE =>
MIPAS O3 validation by ground-based FT-IR measurements METHODOLOGY Comparison of MIPAS v4.61/v4.62 O3 data with O3 profiles and columns from five FT-IR stations: Kiruna (lat. 67.8°N) Jungfraujoch (lat. 46.5°N) Wollongong (lat. 34.4°N) Lauder (lat. 45.0°S) Arrival Heights (lat. 77.5°S) Baseline collocation criteria (slightly relaxed for Wollongong station: Ds < 500 km). MIPAS O3 profiles downgraded to lower vertical resolution, by applying FTIR AKM, and compared with the mean of collocated FTIR measurements recorded within the chosen temporal coincidence criterion. O3 partial column limits defined, taking into account MIPAS lowest altitudes (mean value ~ 12 km) and FT-IR sensitivity (reasonable up to ~ 40 km for O3)
BIRA-IASB IMK-FZK MIPAS O3 validation by ground-based FT-IR measurements Comparison of O3 profiles: RESULTS
BIRA-IASB IMK-FZK MIPAS O3 validation by ground-based FT-IR measurements Comparison of O3 partial columns: RESULTS Statistics1: Ds < 300 km, Dt < 3h Statistics2: Ds < 500 km, Dt < 3h Statistics3: Ds < 200 km, Dt < 3h Station Pressure Range Statistics1 Statistics2 Statistics3 Kiruna 2 –168 hPa +1.3 6.3% [24] ---------------- -----------------Jungfraujoch 3 – 214 hPa +0.3 5.6% [12]+0.8 4.7% [26] ----------------- Wollongong 3 – 196 hPa +1.9 2.3% [4]+3.4 3.9% [19] ----------------- Lauder 2 – 185 hPa -1.6 3.5% [17]-1.1 3.4% [46] ----------------- Arrival Heights 2 – 163 hPa -4.4 11.1% [16]-0.8 13.5% [39] 0.5 5.6 % [9]
MIPAS O3 validation by ground-based FT-IR measurements CONCLUSIONS In the region of the O3 maximum, around 10 hPa, MIPAS and FTIR profiles are in good agreement for all the stations Significant bias around 90 hPa at Wollongong. The standard deviation is within the combined random error from the upper limit of the comparison down to 10 hPa for Arrival Heights and down to 60 hPa for all other stations.
MIPAS O3 validation by lidar measurements (EQUAL project) Methodology Comparison of MIPAS v4.61/v4.62 O3 data with O3 profiles from ground-based lidar measurements obtained by 11 stations of the EQUAL project (ENVISAT QUality Assessment by Lidar) in the period 6th July 2002 to 26th March 2004. Spatial and temporal coincidence criteria: Ds < 800 km, Dt < 20 h Ds < 400 km, Dt < 10 h Ds < 200 km, Dt < 5 h Collocated pairs of MIPAS and lidar O3 profiles represented using number density as a function of altitude: MIPAS profiles altitude grid reconstruction using ECMWF data
Comparison of MIPAS and lidar O3 profiles: RESULTS ALL CASES
Comparison of MIPAS and lidar O3 profiles: RESULTS LATITUDE DEPENDENCY
MIPAS O3 validation by lidar measurements CONCLUSIONS Very good agreement between MIPAS and LIDAR O3 mean profiles: Relative diff. within 5% 20 - 40 km Relative diff. within 15-20% below 20 km and above 40 km Larger differences in the tropical UTLS (up to 40% and higher at 15-20 km) and in the polar stratosphere (-10% < DO3/O3 < –5% at 30 km)
Pseudo-global comparison with O3 data from NDACC stations METHODOLOGY Comparison of MIPAS v4.61 O3 data with correlative measurements from: - 39 ozonesondes stations (O3S) - 8 lidars (LID) - 7 microwave radiometers (MWR) Spatial and temporal coincidence criteria: Ds < 500 km, Dt < 6 h (O3S, LID) Ds < 500 km, Dt < 2 h (MWR) Comparison of O3 profiles and partial columns limited to 2003 data Error budget including: (a) MIPAS and ground-based instrument errors (b) Vertical smoothing error (b) Horizontal smoothing error (c) Error due to geolocation differences Estimates based on assimilated O3 fields by the Belgian Assimilation System of Chemical Observations from ENVISAT (BASCOE).
MIPAS vs NDACC O3 35.0-15.0 hPa PC Pseudo-global comparison with O3 data from NDACC stations RESULTS: time series of O3 partial columns differences O3 partial columns defined on 5 layers ranging from 75 to 0.8 hPa ( 18 - 50 km) Time series of the percentage relative difference in O3 partial columns between MIPAS and ozone sondes data from Western and Central Europe stations
Pseudo-global comparison with O3 data from NDACC stations CONCLUSIONS • Observed differences: • Lower stratosphere => synoptic behaviour (chemistry & dynamics) • Upper stratosphere => zonal behaviour (photochemistry) • Comparison error budget: • Errors due to MIPAS > uncertainty associated to > errors due to vertical • horizontal smoothing geolocation differences smoothing differences • The different error components generally account for the observed • differences in O3 partial columns, with the following exceptions: • In the 75-35 hPa layer at mid-latitudes, equator and tropics • In the 35-15 hPa layer at equator,tropics and Antarctica during O3 hole • In the 3-0.8 hPa layer at European stations
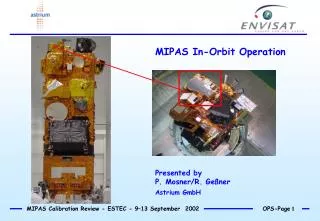
Validation of MIPAS O3 profiles by aircraft/balloon-borne measurements MIPAS-B Balloon-borne version of the MIPAS-ENVISAT instrument, operated by IMK-FZK. Field of view, spectral range, spectral resolution, radiometric noise similar to MIPAS-ENVISAT Correlative measurements: Aire-Sur-L’Adour 43.5°N 24 Sep 2002 Kiruna 67.8°N 20/21 Mar 2003 03 Jul 2003 High quality matching within baseline collocation criteria: 300 km, 3 h Max PV rel. diff. at the tangent points 15%
IMK-FZK Comparison of MIPAS-ENVISAT and MIPAS-B O3 profiles: RESULTS
IMK-FZK Comparison of MIPAS-ENVISAT and MIPAS-B O3 profiles: RESULTS
Comparison of MIPAS O3 profiles with balloon-borne FT-FIR data • FIRS-2 and IBEX • Comparison of MIPAS v4.61 O3 profiles with correlative measurements performed by high resolution FT-FIR spectrometers during balloon flights at mid-latitudes: • FIRS-2 (Far InfraRed Spectromeer, CfA-SAO, USA): Fort Sumner (34°N), Sep 19-20, 2003 • IBEX (Infrared Balloon EXperiment, IFAC-CNR, Italy), Trapani (38°N), Sep 29-30, 2002 • Methodology: • Matching pairs of O3 values identified by means of trajectory calculations • (Global Trajectory Model, Univ. of L’Aquila, Italy) with coincidence criteria: • Dlat < 2deg, Dlat < 2deg, Dt < 2 hours • Binning in Potential Temperature in steps of DQ = 60K • Calculation of mean absolute and relative differences between MIPAS and FIRS-2 (or IBEX) O3 values.
Comparison of MIPAS and FIRS-2 O3 profiles: RESULTS Mean absolute and relative difference between MIPAS and FIRS-2 O3 VMR binned by Potential Temperature values (DQ = 60K)
Validation of MIPAS O3 profiles by satellite intercomparison: SAGE II SAGE II (Stratospheric Aerosol and Gas Experiment) Comparison of MIPAS O3 data v4.61/v4.62 with SAGE II v6.2 collocated data for the period 6th Jul 2002 to 26th Mar 2004. Baseline coincidence criteria (300 km, 3h) 331 matching pairs of O3 profiles No AKs applied because of similar vertical resolution (SAGE 2 to 3 km) Investigation of zonal and seasonal averages of the relative differences MIPAS to SAGE II.
IUP – Univ. Bremen Comparison of MIPAS O3 v4.61/v4.62 and SAGE II v6.2 O3 data: RESULTS Northern Hemisphere Southern Hemisphere Mid latitudes High latitudes
Comparison of MIPAS O3 v4.61/v4.62 and SAGE II v6.2 O3 data: RESULTS Statistics over all comparisons of MIPAS to SAGE II Zone Mean Relative Deviation RMS N.; month of year 80°S-63°S at 70 – 0.7 hPa +2 – +12% 4 - 10% 69; Dec 03, Feb 04 28°S-55°S at 60 – 0.5 hPa -4 – +8% 5 - 10% 64; Jan 03/04,Apr-May 03,Jul 03 45°N-60°N at 70 – 0.6 hPa -5 – +4% 4 - 9% 29; Jan+Mar 03,Apr 03,Jul 02/03 60°N-76°N at 70 – 0.6 hPa -3 – +4% 4 - 7% 169; Apr+Jun 03, Jul 02/03, Sep 03 Season Spring at 60 – 0.7 hPa +2 +9% 3 10% 37 Summer at 65 – 1.5 hPa +1 +10% 4 10% 45 Fall at 60 – 0.4 hPa -6 +8% 4 10% 25 Winter at 65 – 1.0 hPa -4 +8% 5 10% 26 Spring at 80 – 0.5 hPa -4 +4% 3 10% 101 Summer at 60 – 0.7 hPa -4 +4% 4 10% 95 at 70 – 0.7 hPa -1 +4% 6 10% 331 Conclusions MIPAS and SAGE II O3 profiles agree within 5% (RMS <10%) at 70 to 0.6 hPa Positive bias of MIPAS to SAGE in high southern latitudes spring and summer (up to 12%, RMS <10%), not in SH fall/ winter and in NH spring/summer SH NH ALL
Validation of MIPAS O3 profiles by satellite intercomparison: GOME GOME (Global Ozone Monitoring Instrument) Validation of MIPAS v4.61 data against GOME O3 profiles (retrieved by using the retrieval scheme developed at RAL) for four selected months (Sep 2002, Dec 2002, March 2003, May 2003) covering the time range with global coverage from both instruments. Baseline coincidence criteria (300 km, 3h). Interpolation of MIPAS O3 profiles to GOME pressure grid and application of GOME AKs to MIPAS data to match the lower vertical resolution of GOME profiles.
Validation of MIPAS O3 v4.61 data with RAL GOME data: RESULTS DEC 2002 SEP 2002 MAR 2003 MAY 2003
Validation of MIPAS O3 v4.61 data with RAL GOME data: CONCLUSIONS MIPAS and GOME are in generally good agreement within the error bars of the two instruments Between 10 and 1 hPa MIPAS is higher than GOME by 10-20% for 3 of the 4 months (generally within the combined total error). In September 2002 MIPAS is lower than GOME that is known to be affected by additional errors in this period and might be responsible for the differences in comparison with the remaining months.
MIPAS O3 coordinated validation: SUMMARY A coordinated effort was carried out to combine and to better exploit the information from different activities for the validation of MIPAS ozone data. Consolidated results are presently available from intercomparison of MIPAS v4.61/v4.62 data with O3 measurements from a compehensive database of individual validation experiments. Final merging of these results is currently in progress, to produce an overall assessment of MIPAS O3 data quality and to provide an uptodate estimate of their accuracy and precision. Final outcomes of the coordinated activity will be published in a dedicated paper (in preparation) to be submitted to Atmospheric Chemistry and Physics, as part of a Special Issue about MIPAS-ENVISAT validation.