Download
1 / 22
260 likes | 534 Views
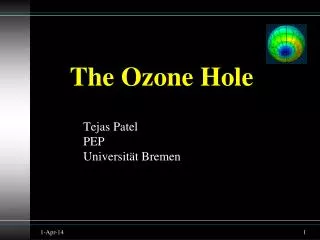
The Ozone Story Presentation. Ozone Secretariat UNEP (updated July 2003). 80. MESOSPHERE. 60. STRATOSPHERE. 40. TROPOSPHERE. 20. Ozone Partial Pressure ( b). km. 0. 50. 100. 150. Ozone Distribution in the Atmosphere. Scientific Background I History.

E N D
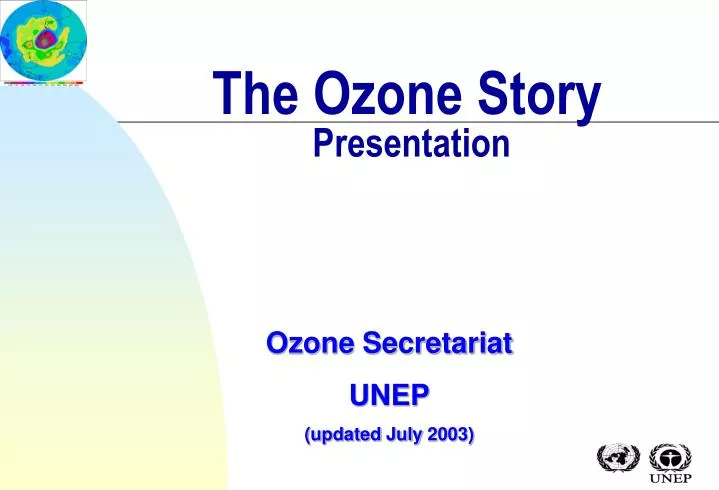
The Ozone Story Presentation Ozone Secretariat UNEP (updated July 2003)
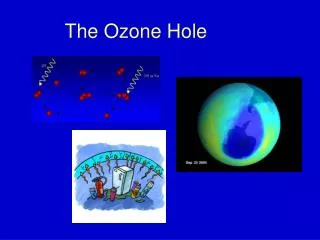
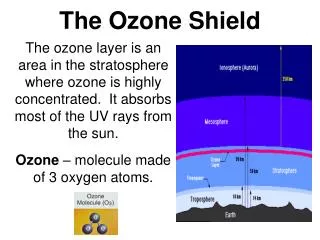
80 MESOSPHERE 60 STRATOSPHERE 40 TROPOSPHERE 20 Ozone Partial Pressure (b) km 0 50 100 150 Ozone Distribution in the Atmosphere
Scientific Background IHistory 1839:Ozone discovered by C. F. Schönbein when observing electrical discharges. 1850s: Ozone shown to be a natural atmospheric constituent. 1880: Experiments show that Ozone strongly absorbs Solar Ultraviolet (UV) radiation. 1913: Proof that most of the atmosphere's ozone is located in the stratosphere. 1920: G. M. B. Dobson (an Oxford Scientist) perfected an instrument to monitor quantitatively total atmospheric ozone.
Scientific Background IIThe Current Science • The global Ozone layer recovery has been linked mainly to decreasing Chlorine and Bromine loading, but other factors such as the role of Green house gases and climate change are likely to contribute. • Total Combined effective abundance of Ozone depleting compounds in the lower atmosphere peaked in 1992-1994 and since then it has been declining slowly. • The abundance of HCFCs in the lower atmosphere is increasing. • Chlorine abundance in the stratosphere is at or near its peak but Bromine abundance seems to be still increasing.
Scientific Background IIThe Current Science (continued.) • The ozone depletion in the Antarctic, the Arctic and the mid-latitudes is still continuing, due to past emissions of CFCs. It will peak in the next few years. • The Montreal Protocol is working and Ozone depletion from the Protocol’s controlled substances is expected to start recovering within the next decade or so. • Even with full compliance of the Montreal Protocol, the Ozone layer will remain particularly vulnerable for the next decade or so. Failure to comply with the Montreal Protocol will delay or even prevent the recovery of the Ozone layer.
CFCs: Ozone Depleting Substances 1928: CFCs invented; 1950-70s: Consumption and use of CFCs rises rapidly during the 50s-70s period. Used in Aerosols, Refrigeration, Air Conditioning and Manufacturing of Foams.
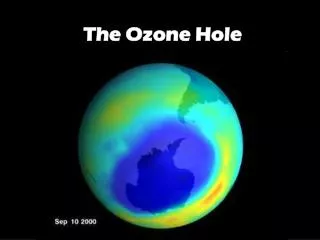
Scientific Activity on Ozone 1971: CFCs measured in the atmosphere. 1974: Rowland and Molina link CFCs with Ozone Depletion. 1977: Plan of Action on Ozone Layer established by UNEP in collaboration with WMO. UNEP sets up Co-ordinating Committee on Ozone Layer (CCOL). 1985: Findings on "The Ozone Hole" over the Antarctic (during spring) published by the British Antarctic Survey.
Scientific Activity on Ozone(continued.) 1985: First Scientific Assessment of Stratospheric Ozone. 1987: Observations prove that the more the Chlorine in the Atmosphere, the less the amount of Ozone. 1989: Scientific Assessment of Stratospheric Ozone under the Vienna Convention and Montreal Protocol 1991: Scientific Assessment of Ozone Depletion under the Vienna Convention and Montreal Protocol.
Scientific Activity on Ozone(continued.) 1994: Scientific Assessment of Ozone Depletion under the Vienna Convention and Montreal Protocol. 1995: Nobel prize received by 3 scientists (Crutzen, Molina and Rowland) for pioneering the research on Ozone Depletion. 1998: Scientific Assessment of Ozone Depletion under the Vienna Convention and Montreal Protocol. 2002: Scientific Assessment of Ozone Depletion under the Vienna Convention and Montreal Protocol.
International Commitments 1985: Vienna Convention for the Protection of the Ozone Layer calls for voluntary measures to reduce emissions of ozone-depleting substances (ODS). 1987: Montreal Protocol on Substances that Deplete the Ozone Layer establishes a schedule to reduce the production and consumption of CFCs and Halons.
International Commitments(continued.) 1990,92,95,97,99: At meetings in London, Copenhagen, Vienna, Montreal and Beijing Parties approve adjustments and/or amendments to the Montreal Protocol to stipulate/accelerate the phase-out schedules and add additional ozone-depleting substances to the list. 1994: production and consumption of Halons by developed countries is stopped except for essential uses.
Ratification of the Montreal Protocol(July 2003) Countries that have NOT ratified the Montreal Protocol Niue Andorra Holy Sea San Marino East Timor Afghanistan Bhutan Cook Islands Equatorial Guinea Eritrea Iraq Countries that have NOT Ratified the Montreal Protocol (11 Countries)
International Commitments(continued.) 1995: The phase-out schedule of all Ozone depleting substances applicable to developing parties is agreed by the parties with a ten-year grace period. 1996: Production and consumption of CFCs , Carbon tetrachloride and methyl chloroform by developed countries stopped except for essential uses while consumption of HBFCs stopped for all parties 1997: A system for licensing the import and export of all ozone depleting substances becomes mandatory to all parties to the Montreal Protocol in order to control illegal trade.
Financial Mechanism - The Multilateral Fund of the Montreal Protocol 1991:The Multilateral Fund established, with UNDP, UNEP, UNIDO and World Bank as the implementing agencies, to provide financial and technical assistance to developing countries (Article 5) to enable them comply with the control measures. • The Multilateral Fund of the Protocol has been very successful. It has, between 1991 - 2002 disbursed close to $1.5 billion to more than 100 developing countries to phase-out more than half of their CFC consumption. It will continue assistance till the phase-out is completed.
Achievements • Global Production of CFCs and Halons fell by over one million tonnes (by 89%) between 1986 and 2000. • Global Consumption fell in the same period by the same margin (89%) • Atmospheric Concentration of Chlorine peaked in 1994 and is now declining. • Millions of cases of Eye Cataracts and Skin Cancer averted • Recovery of the Ozone Layer expected by the year 2050, if the Protocol is fully implemented by all Parties.
Atmospheric Concentrations of CFC-11, CFC-12, CFC-113, Carbon Tetrachloride, Methyl Chloroform and Total Gaseous Chlorine
If there were no Protocol, ..... • The ozone depletion by the year 2050 would have been at least 50% in the mid latitudes in the northern half of the earth, 70% in the mid latitudes of the south, about 10 times larger than today. The UV-B radiation would have doubled in the north and quadrupled in the south in the same places. The ozone depleting chemicals in the atmosphere would have been 5 times higher. • The implications of this increase would have been horrendous - 19 million more cases of non- melanoma cancer, 1.5 million cases of melanoma cancer, 130 million more cases of eye cataracts.
Challenges • Many Parties are yet to ratify the Amendments to the Montreal Protocol. • Meeting the control measures for production and consumption of CFCs in the developing countries: 1. The developing countries began their phase-out of ODSs with a freeze on CFCs from 1 July 1999, and a freeze from 1 January 2002 on Halons and Methyl Bromide. 2. In 2005, a 50% reduction in CFCs and Halons, and a 20% reduction in Methyl Bromide, is required.
Challenges(continued.) • Meeting the control measure of complete phase- out of Methyl Bromide in the industrialised countries in 2005 and minimzing the quantities of Methyl Bromide used in those countries through Critical Use Exemptions. • Meeting the control measure of 35% reduction of the production and consumption of HCFCS in the industrialised countries from 1 January 2004.
Challenges(continued.) • Flow of illegal CFCs to the industrialised countries is of concern. Developing countries are concerned about increasing flow to their countries of CFC- containing products, for example refrigerators, from countries, which have adopted Ozone-safe products. This will increase the demand for CFCs for maintenance of these products in developing countries implementation of ODS licensing system could check this problem. • Global warming could increase ozone depletion. Also, HFCs, used as alternatives for CFCs in some applications, have global warming potential and are controlled by the Kyoto Protocol. These inter- connections need to be studied.