Download
1 / 1
10 likes | 424 Views
ABSTRACT

E N D
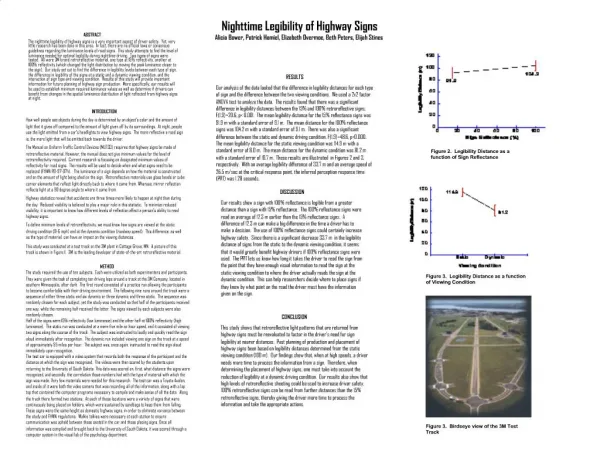
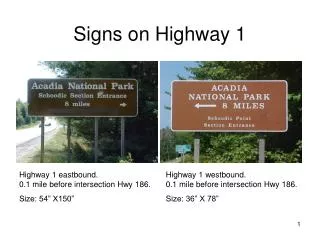
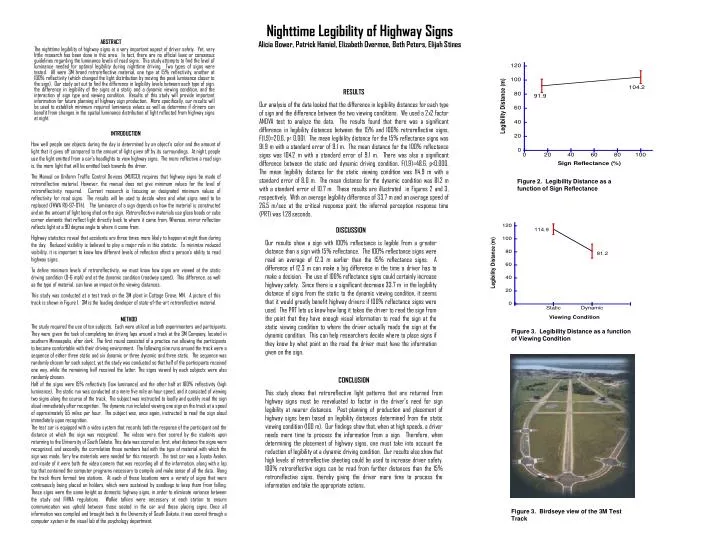
ABSTRACT The nighttime legibility of highway signs is a very important aspect of driver safety. Yet, very little research has been done in this area. In fact, there are no official laws or consensus guidelines regarding the luminance levels of road signs. This study attempts to find the level of luminance needed for optimal legibility during nighttime driving. Two types of signs were tested. All were 3M brand retroreflective material, one type at 15% reflectivity, another at 100% reflectivity (which changed the light distribution by moving the peak luminance closer to the sign). Our study set out to find the difference in legibility levels between each type of sign, the difference in legibility of the signs at a static and a dynamic viewing condition, and the interaction of sign type and viewing condition. Results of this study will provide important information for future planning of highway sign production. More specifically, our results will be used to establish minimum required luminance values as well as determine if drivers can benefit from changes in the spatial luminance distribution of light reflected from highway signs at night. Nighttime Legibility of Highway SignsAlicia Bower, Patrick Hamiel, Elizabeth Overmoe, Beth Peters, Elijah Stines RESULTS Our analysis of the data looked that the difference in legibility distances for each type of sign and the difference between the two viewing conditions. We used a 2x2 factor ANOVA test to analyze the data. The results found that there was a significant difference in legibility distances between the 15% and 100% retroreflective signs, F(1,9)=20.6, p< 0.001. The mean legibility distance for the 15% reflectance signs was 91.9 m with a standard error of 9.1 m. The mean distance for the 100% reflectance signs was 104.2 m with a standard error of 9.1 m. There was also a significant difference between the static and dynamic driving condition, F(1,9)=48.6, p<0.000. The mean legibility distance for the static viewing condition was 114.9 m with a standard error of 8.0 m. The mean distance for the dynamic condition was 81.2 m with a standard error of 10.7 m. These results are illustrated in Figures 2 and 3, respectively. With an average legibility difference of 33.7 m and an average speed of 26.5 m/sec at the critical response point, the inferred perception response time (PRT) was 1.28 seconds. INTRODUCTION How well people see objects during the day is determined by an object’s color and the amount of light that it gives off compared to the amount of light given off by its surroundings. At night, people use the light emitted from a car’s headlights to view highway signs. The more reflective a road sign is, the more light that will be emitted back towards the driver. The Manual on Uniform Traffic Control Devices (MUTCD) requires that highway signs be made of retroreflective material. However, the manual does not give minimum values for the level of retroreflectivity required. Current research is focusing on designated minimum values of reflectivity for road signs. The results will be used to decide when and what signs need to be replaced (FHWA RD-97-074). The luminance of a sign depends on how the material is constructed and on the amount of light being shed on the sign. Retroreflective materials use glass beads or cube corner elements that reflect light directly back to where it came from. Whereas, mirror reflection reflects light at a 90 degree angle to where it came from. Highway statistics reveal that accidents are three times more likely to happen at night than during the day. Reduced visibility is believed to play a major role in this statistic. To minimize reduced visibility, it is important to know how different levels of reflection affect a person’s ability to read highway signs. To define minimum levels of retroreflectivity, we must know how signs are viewed at the static driving condition (0-6 mph) and at the dynamic condition (roadway speed). This difference, as well as the type of material, can have an impact on the viewing distances. This study was conducted at a test track on the 3M plant in Cottage Grove, MN. A picture of this track is shown in Figure 1. 3M is the leading developer of state-of-the-art retroreflective material. Figure 2. Legibility Distance as a function of Sign Reflectance DISCUSSION Our results show a sign with 100% reflectance is legible from a greater distance than a sign with 15% reflectance. The 100% reflectance signs were read an average of 12.3 m earlier than the 15% reflectance signs. A difference of 12.3 m can make a big difference in the time a driver has to make a decision. The use of 100% reflectance signs could certainly increase highway safety. Since there is a significant decrease 33.7 m in the legibility distance of signs from the static to the dynamic viewing condition, it seems that it would greatly benefit highway drivers if 100% reflectance signs were used. The PRT lets us know how long it takes the driver to read the sign from the point that they have enough visual information to read the sign at the static viewing condition to where the driver actually reads the sign at the dynamic condition. This can help researchers decide where to place signs if they know by what point on the road the driver must have the information given on the sign. METHOD The study required the use of ten subjects. Each were utilized as both experimenters and participants. They were given the task of completing ten driving laps around a track at the 3M Company, located in southern Minneapolis, after dark. The first round consisted of a practice run allowing the participants to become comfortable with their driving environment. The following nine runs around the track were a sequence of either three static and six dynamic or three dynamic and three static. The sequence was randomly chosen for each subject, yet the study was conducted so that half of the participants received one way, while the remaining half received the latter. The signs viewed by each subjects were also randomly chosen. Half of the signs were 15% reflectivity (low luminance) and the other half at 100% reflectivity (high luminance). The static run was conducted at a mere five mile an hour speed, and it consisted of viewing two signs along the course of the track. The subject was instructed to loudly and quickly read the sign aloud immediately after recognition. The dynamic run included viewing one sign on the track at a speed of approximately 55 miles per hour. The subject was, once again, instructed to read the sign aloud immediately upon recognition. The test car is equipped with a video system that records both the response of the participant and the distance at which the sign was recognized. The videos were then scored by the students upon returning to the University of South Dakota. This data was scored on, first, what distance the signs were recognized, and secondly, the correlation those numbers had with the type of material with which the sign was made. Very few materials were needed for this research. The test car was a Toyota Avalon, and inside of it were both the video camera that was recording all of the information, along with a lap top that contained the computer programs necessary to compile and make sense of all the data. Along the track there formed two stations. At each of these locations were a variety of signs that were continuously being placed on holders, which were sustained by sandbags to keep them from falling. These signs were the same height as domestic highway signs, in order to eliminate variance between the study and FHWA regulations. Walkie talkies were necessary at each station to ensure communication was upheld between those seated in the car and those placing signs. Once all information was compiled and brought back to the University of South Dakota, it was scored through a computer system in the visual lab of the psychology department. Figure 3. Legibility Distance as a function of Viewing Condition CONCLUSION This study shows that retroreflective light patterns that are returned from highway signs must be reevaluated to factor in the driver’s need for sign legibility at nearer distances. Past planning of production and placement of highway signs been based on legibility distances determined from the static viewing condition (100 m). Our findings show that, when at high speeds, a driver needs more time to process the information from a sign. Therefore, when determining the placement of highway signs, one must take into account the reduction of legibility at a dynamic driving condition. Our results also show that high levels of retroreflective sheeting could be used to increase driver safety. 100% retroreflective signs can be read from further distances than the 15% retroreflective signs, thereby giving the driver more time to process the information and take the appropriate actions. Figure 3. Birdseye view of the 3M Test Track