Download
1 / 38
530 likes | 664 Views
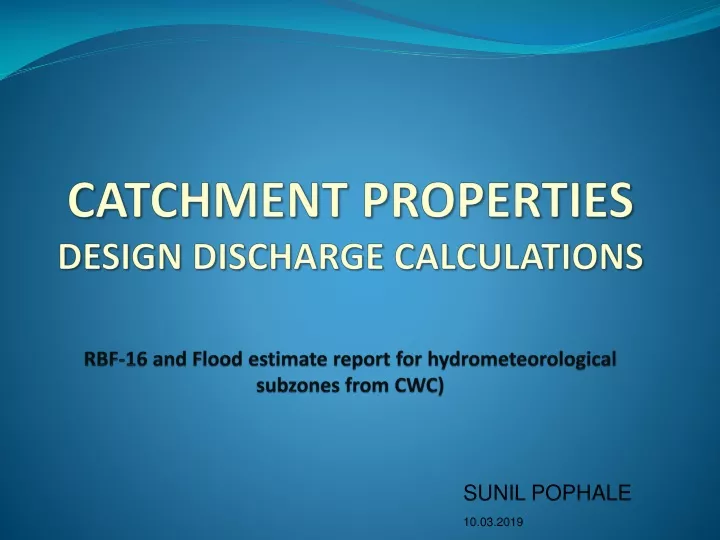
CATCHMENT PROPERTIES DESIGN DISCHARGE CALCULATIONS RBF-16 and Flood estimate report for hydrometeorological subzones from CWC). SUNIL POPHALE 10.03.2019. Design discharge :. It is the discharge for which a bridge, hydrological structure and or its appurtenances are designed.

E N D
CATCHMENT PROPERTIESDESIGN DISCHARGE CALCULATIONSRBF-16 and Flood estimate report for hydrometeorological subzones from CWC) SUNIL POPHALE 10.03.2019
Design discharge : • It is the discharge for which a bridge, hydrological structure and or its appurtenances are designed .
Why design discharge ? • It is required for properand economicaldesign,construction and maintenanceof • Bridge water way • Foundations • Protection works • Other parameters • Afflux • Free board & vertical clearances
Design discharge • Para 4 of substructure code –Hydrological design investigations “4.2.1 The estimation of design discharge for waterway shall preferably be based, wherever possible, on procedures evolved from actual hydro meteorological observations of the same or similar catchments.”
BRIDGE LOCATION : • Latitude and Longitude • 2. Find out Toposheet / Toposheets • (Numbering, Index and scale of toposheet)
Physiographic Parameters : • Marking of catchment boundary on toposheet(up-stream, Dn-stream, Hills, end points of the streams etc.) • 2. Calculate Area of Catchment • (Plannimeter, graph paper) • Adopt appropriate method • RBF-16 for A < 25 sq.km • UH / SUH for A > 25 sq.km
Length of the longest stream • ( along the stream) • 4. Find out Centre of Gravity of the catchment • 5. Measure Length of Concentration • (From Bridge to nearest point of CG on the longest stream) • 6. Measure Segment Lengths of the longest stream • ( cutting of counter lines to the longest stream) • Calculate equivalent stream slope
Typical river system Q Q Q Q Q Q Q Q Q = Discharge
Shape, size and slope of the catchment A catchment that is shaped in the form of a pear, with the narrow end towards the upstream and the broader end nearer the catchment outlet (Figure 1a) shall have a hydrograph that is fast rising and has a rather concentrated high peak
Shape, size and slope of the catchment… A catchment with the same area but shaped with its narrow end towards the outlet (oblong shape) has a hydrograph that is slow rising and with a somewhat lower peak (Figure 2) for the same amount of rainfall.
Catchment Parameters AREA OF CATCHMENT - A 5 LENGTH OF LONGEST STREAM : L Along the Stream In Km CG OF THE CATCHMENT LENGTH OF STREAM FROM NEAREST TO CG TO THE BRIDGE SITE – Lc Length of concentration 4 EqivalentOR StasticalSTREAM SLOPE m/Km 3 L Lc 2 1
Sub-zone reports: • (Flood estimation reports of CWC) • Latitude and Longitude • Find out Sub-zone report
4.3.3 Where records of floods are not ofsufficient length to permit reliable statisticalanalysis but where rainfall pattern and intensity records are available for sufficient length of time and where it is possible to carry out at least limited observations of rainfall and discharge, unit hydrographs based on such observations may be developed and design discharge of the desired recurrence interval computed by applying appropriate design storm.
Unit Hydrograph Method-(For Catchment Area 25 to 2500 SqKms) • Concurrent rainfall-runoff observations available are small, but long term rain fall data are available • Definition: • Unit hydrograph is defined as a hydrograph of direct surface run off resulting from unit effective excess rainfall generated uniformly over catchment area for a specified period (Unit duration) • Limitations: • It reflects combined effects of rainfall, loss rate, physiographic factors. These factors may change with time
Unit Hydrograph Method- For a given watershed • Storms of equal duration will produce runoff hydrographs with equivalent time bases regardless the intensity of rain. • Inst. discharge will be proportional to volume of surface runoff produced by storms of equal duration. • Time distribution of runoff from a given storm period is independent of precipitation from antecedent or subsequent storm periods
Typical Unit Hydrograph
Unit Hydrograph Method (cont) • Limitations • Non-areal distribution over large catchments • Not applicable for catchments >5000sq km????? • This method is not applicable for runoff from snow or ice melt • Assumes no changes in topographical & physiographical features
Estimation of design discharge by unit hydrograph • Derivation of unit hydrograph • Selection and evaluation of design storm • Assessment of design loss-rate • Assessment of effective rainfall of unit duration • Construction of unit hydrograph and addition of base flow • Work out flood hydrograph
Selection and evaluation of design storm • Duration of design storm td = 1.1 tp • Point rainfall • By statistical analysis or isopluvial maps • Point to areal rainfall • Available subzonal /regional wise • Distribution of design storm
Synthetic Unit Hydrograph • Concurrent rainfall-runoff observations are not available • Hydro-meteorological homogeneous regions or such zones are identified as unit • equations developed to derive synthetic unit hydrographs • Steps to calculate flood discharge are similar to unit hydrograph
r t 1 Cm RAINFALL EXCESS p t TYPICAL UNIT HYDROGRAPH W 75 W R75 3 Q p W DISCHARGE IN m /s 50 W R50 s T TIME IN HOURS
Other Methods • Simplified equations for various sub zones Q50 = CAmLnSpRqtd Used for preliminary survey/checks or temporary structure
Simplified equations for various sub zones • Q50 = CAmLnSpRqtd Used for preliminary survey/checks or temporary structure For medium size catchments i.e. 25 to 5000 sq km Q50 =K Φ (A, L, Lc,Se/ Sst, R td) K= a factor depending on catchment size (different for various sub-zones) A= Catchment area L= length of longest stream Lc=length of main stream opposite to a point on centroid Se= Equivalent stream slope (m/Km) Sst = Statistical stream slope (m/Km) R td = Pt. rainfall of 50 years return period and td duration
Hydro meteorological zones Use of flood estimation reports : The country has been divided into 7 hydro meteorological zones and 26 subzones .Flood estimation reports have been published. (a joint work of CWC, RDSO, IMD, and MOST)
Flood estimation for small catchments : area < 25 sq km – RDSO report RBF-16
Very Small Catchment This term has not been defined specifically but has bearing on one or more of the following aspects Size of bridge opening Size of drainage area Predominance of overland flow Quick response time Greater influence of rainfall characteristics Drainage basin having steeper slope with little or no storage CATCHMENT WITH AREA < 25 Sq.KM
Catchment characteristics Almost uniform distribution of rainfall for time equal to tc (time of concentration) Flood stages rises quickly and attains a peak in short time Nature of soil, slope and vegetation are such that they do not delay the runoff tc is very small therefore we need UH of very small unit duration. Such data of small intervals are generally not available.