Download
1 / 35
350 likes | 549 Views
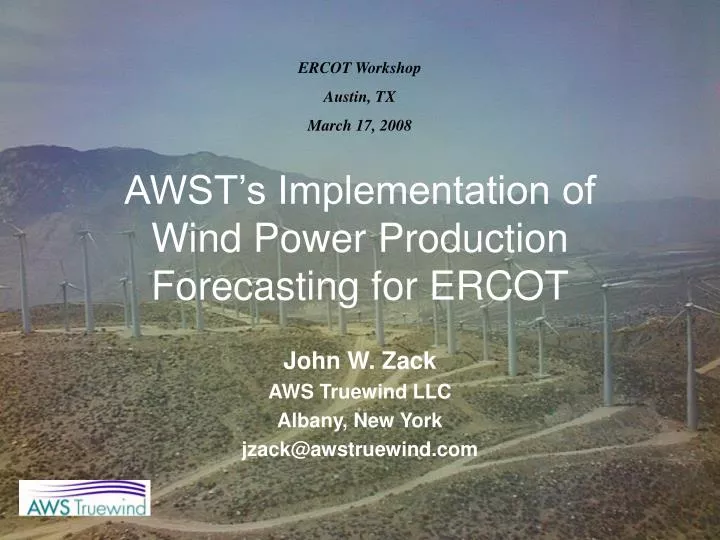
ERCOT Workshop Austin, TX March 17, 2008. AWST’s Implementation of Wind Power Production Forecasting for ERCOT. John W. Zack AWS Truewind LLC Albany, New York jzack@awstruewind.com. Overview. State-of-the-Art Forecasting Tools Forecasting Time Scales AWST’s ERCOT Forecast System

E N D
ERCOT Workshop Austin, TX March 17, 2008 AWST’s Implementation of Wind Power Production Forecasting for ERCOT John W. Zack AWS Truewind LLC Albany, New York jzack@awstruewind.com
Overview • State-of-the-Art Forecasting Tools • Forecasting Time Scales • AWST’s ERCOT Forecast System • Forecasting the Future of Forecasting
Overview of the State-of-the-Art inWind Power Production Forecasting What are the tools used in forecasting? How are they typically used?
Physics-based Models • Differential equations for basic physical principles are solved on a 3-D grid • Must specify initial values of all variables at each grid point and properties of earth’s surface • Simulates the evolution of the atmosphere in a 3-D volume • Many different models • Eta, GFS, MM5, WRF, MASS etc. • Same basic equations with subtle but critical differences • Can be customized for an application
Physics-based Simulation Example • Forecast of the evolution of the 50 m winds over southern Texas during a 66-hr period beginning 6 PM CST on 26 Feb 2008 • Requires ~ 9.4 trillion operations (add, multiply etc.)
Physics-based ModelsKey Performance Factors • Initial values for all prognostic variables must be specified for every grid cell • Boundary values must be specified for all boundary cells (usually from another model with a larger domain) • Grid has finite resolution - some processes are at the “sub-grid” scale and feedback to affect grid scale • Surface properties (roughness, heat capacity etc.) of the earth must be specified or modeled
Statistical Models • Empirical equations are derived from historical predictor and predictand data (“training sample”) • Current predictor data and empirical equations is then used to make forecasts • Many types of models • Time series, MLR, ANN, SVR • More sophisticated does not always mean better performance
Statistical Models:Performance Factors • Type & configuration of the statistical model and training algorithm • Size, quality and representativeness of the training sample • Input variables made available for training • The type of relationships that actually exist Issue: difficult to understand the reasons for observed performance
Plant Output Models • Relationship of met variables to power production • Could be physical or statistical • Often based on wind speed but can consider other variables
One of the keys to accurate forecasts… High quality data from the plant Desired Data from Wind Plant Desired Wind Plant Data for Forecasting • Power production and turbine availability • Met tower within 5km and 100m elevation of each turbine • Wind speed and direction at hub height and T and P at 2m • One met tower with two levels of data • T and P at 2m and hub height • Wind speed and direction at hub height and hub height - 30m • Consistent monitoring and calibration of data Well-Behaved Data Data with Issues
Forecast Ensembles • Uncertainty present in any forecast method due to • Input data • Model type and configuration • Approach: perturb input data and model parameters within their range of uncertainty and produce a set of forecasts • Benefits • Ensemble composite is often the best forecast • Spread of ensemble provides a case-specific measure of uncertainty
Forecasting Time Scales How does the wind power production forecasting challenge vary with the look-ahead period?
Hours-ahead Forecasts • Must forecast small scale weather features • Large eddies, local-scale circulations • Rapidly-changing, short life-times • e.g. cloud features, mountain circulations, sea/land breezes • Typically poorly defined by current observing systems • Tools: • Difficult to use physics-based models • Autoregressive statistical models on wind farm time series data • Supplement with offsite predictor data • Errors grow rapidly with increasing look-ahead time
Days Ahead Forecasts • Little skill in forecasting small-scale features • Forecast skill mostly from medium and large scale weather systems • Well-defined by current sensing networks • Tools: • Physics-based model simulations are the best tool • Statistical models used to adjust physics-based output (MOS) • Regional & continental scale weather data are most important • Errors grow slowly with increasing look-ahead time
The ERCOT Forecast System What input data is used? How is AWST’s system configured for the ERCOT application? Why was it configured that way? What products are delivered?
Forecast System Input • Production data (from ERCOT) • Hourly increments, reported once per hour • Power production (MW) • Historical turbine availability • Planned outages • WGR Met data (from WGRs) • Hourly increments, reported once per hour • Parameters: Wind speed, wind direction, temperature and pressure • At whatever height available • Regional weather data (from NWS and other sources) • NWP data (from US NWS and Environment Canada)
General Approach & Philosophy • Apply AWST’s extensively used eWind system • Forecast met variables with physics and statistical models • Use plant output model to obtain power production forecast • Employ sophisticated quality control of input data • Configure and customize physics-based and statistical models for optimum performance in Texas • Employ an ensemble forecasting scheme • Ensemble members created by varying factors that are most significant in producing uncertainty in forecasts in Texas • Input data • Model parameters • Construct an optimal composite forecast based on recent performance of all ensemble members
The Implementation • Ensemble of physics-based models • Ensemble of statistical models • Plant output model
Physics-based SimulationsTypes • Two physics-based models • MASS: Mesoscale Atmospheric Simulation System • Developed and maintained by MESO, Inc (AWST partner) • Has a 25-year history of development and application • Customized by AWST/MESO for wind energy forecasting in 1990’s • WRF: Weather Research and Forecasting model • New community model developed by US consortium including NCAR & NWS • In widespread use for several years • Eight types of physics-based simulations • Two models: MASS and WRF • Four Initializations: US NAM, US GFS, US RUC, EC Global GEM • Output used as input into statistical models
Physics-based Forecast SimulationsConfigurations • Nested grids over Texas and vicinity • 6 to10 km horizontal grid cell size for highest resolution nest • Initialized every 6 hrs • Length of simulations: 72 hrs • 3-D grid point output data saved every hour
Short-term (0-6 hrs) Statistical Met Variable Forecasting • Ensemble of 12 different statistical methods • Separate statistical forecast model for each look-ahead hour for each forecast methods • Ensemble based on varying several factors (emphasis on statistical models and onsite and offsite data) • Type of statistical algorithm (Linear regression, ANN etc.) • Training sample size and time period (regime-based) • Type and amount (# of variables) of input data • Time series of met and power data • Off-site met tower or remotely sensed data • Physics-based model output data • Statistical procedure used to construct an optimal composite forecast from ensemble members based on recent performance
Short-term forecasting (0-6 hrs)Customization for Texas • Use offsite data types available in Texas • Analyze time series of data from Texas wind farms • Determine autocorrelation structure • Use most appropriate statistical procedures • Identify significant offsite time-lagged spatial relationships for each forecast site • Analyze patterns and relationships in high-resolution numerical simulations and observed data • Define Texas-specific regimes for statistical modeling
Intermediate-term Statistical Met Variable Forecasting (7-48 hrs) • Ensemble of 24 different statistical forecasts • Separate statistical forecast model for each look-ahead hour for each forecast method • Ensemble based on varying several factors (emphasis on physics-based models) • Type of statistical algorithm • Training sample size and time period • Type of physics-based model • Source of physics-based model initialization and boundary data • Statistical procedure used to construct an optimal composite forecast from ensemble members based on recent performance
Intermediate-term Forecasting Customization for Texas • Customize surface property databases for Texas • Standard databases often have misrepresentations • Customize physics-based model to optimally simulate phenomena important in Texas • Low level jets (reverse turbulence profile) • Shallow cold air surges • Intense thunderstorms • Configure model grids to have high grid resolution in areas critical to wind farm wind variation • Texas-specific regimes for statistics
Plant Output Model • Two models • Plant-scale power curve • Power curve deviation model • Wind direction • Atmospheric stability • Why two models? • Data quality and quantity • Forecast obtained by using ensemble composite of met variable forecasts as input
Plant Output Model Issue Turbine Availability Reporting • Reporting of actual turbine availability has been very inconsistent in other applications • Projected (scheduled) availability often left at 100% • Example depicts both missing and probably inaccurate actual availability data. 100% availability was specified for all hours on the chart
Short Term Wind Power Forecast(STWPF) • The STWPF is a forecast of the most likely value of power production. • STWPF forecasts are created for individual WGRs and the aggregate of all ERCOT WGRs. • The STWPF is produced each hour and extends 48 hours.
Wind Generation Resource Power Potential(WGRPP) • 80% Probability of Exceedence (POE) forecast is calculated for the aggregate output of all WGRs. • WGRPP for the aggregate must be the sum of the WGRPP for individual WGRs. • The WGRPP for individual WGRs is calculated by disaggregating the aggregate WGRPP forecast. • The WGRPP is produced each hour and extends 48 hours
WGRPP Disaggregation • The 80% POE forecast for the aggregate is larger than the sums of the 80% POE forecasts for the individual WGRs. • Aggregate WGRPP forecast is disaggregated to create WGRPP forecasts for each WGR. • Disaggregation is based on the error correlation between the WGRs.
The Result • Chart depicts rolling 6-hr ahead forecast of aggregate power production • Period 26 Feb 12 CST to 28 Feb 12 CST • Red line: STWPF • Green line: WGRPP
Forecasting the Future of Forecasting What is being (can be) done to improve forecast performance?
How will forecasts be improved?(Top Three List) • (3) Improved physics-based/statistical models • Improved physics-based modeling of sub-grid and surface processes • Better data assimilation techniques for physics-based models • Learning theory advances: how to extract more relevant info from data • (2) More effective use of models • Enabled by more computational power • Higher resolution, more frequent physics-based model runs • More sophisticated use of ensemble forecasting • Use of more advanced statistical models and training methods • (1) More/better data • Expanded availability and use of “off-site” data in the vicinity of wind plants, especially from remote sensors • A leap in quality/quantity of satellite-based sensor data
New Remote Sensing Technology • Low-power, low-cost, dual-polarization phased array Doppler radars on cellular towers being developed by CASA (Center for Adaptive Sensing of the Atmosphere) • Target price: $50 K per unit • Commercial availability: 2009-2010 • Small enough to mount on cell towers; • Will measure atmosphere below 1 km that is not visible to current National Weather Service NEXRAD Doppler radar (72% of atmosphere below 1 km is not visible to current NWS system) • Provide winds with resolution in 100’s of meters out to 30-50 km • New data every few minutes • Attempt currently being made to organize a field project in Tehachapi Pass in California to evaluate the value of this technology to short-term wind energy forecasting
Summary • AWST’s Approach to Forecasting: eWind • Widely used and verified for wind power productions forecasts in North America • Based on an ensemble of forecasts from several physics-based and statistical models using different datasets • Extensive customization for forecasting in Texas • General Points About Forecasting • Forecast quality has strong dependence on quality and quantity of data from the wind generation facilities • Forecast systems can and should be customized to meet the requirements of a particular application • Forecast technology is changing rapidly - need system/team that can keep pace with the evolution of forecasting technology