Download
1 / 43
500 likes | 868 Views
Airborne Laser Technology for Hydrography and Coastal Mapping (LIDAR). Grady Tuell, Ph.D. ftp://moray.dms.usm.edu/beyond_navigation_workshop. Introduction to Optech Introduction to SHOALS Characterization of SHOALS performance Depth accuracy Depth penetration Horizontal accuracy

E N D
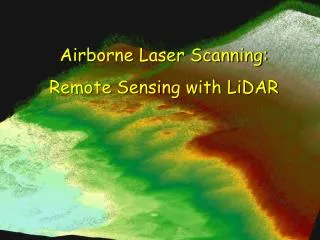
Airborne Laser Technology for Hydrography and Coastal Mapping (LIDAR) Grady Tuell, Ph.D. ftp://moray.dms.usm.edu/beyond_navigation_workshop
Introduction to Optech • Introduction to SHOALS • Characterization of SHOALS performance • Depth accuracy • Depth penetration • Horizontal accuracy • Beyond Safety of Navigation • Auto-extraction of shoreline • Topo/bathy visualizations • Active bottom images (pseudoreflectance) • 3D Benthic Mapping • Water Column Data
ALTM and SHOALS pulse repetition rates 0.01 MW 500 MW
Global Deployment of Optech Airborne Systems 1. Japan Coast Guard 3. Fugro Pelagos 2. JALBTCX
SHOALS-1000T Near shore On shore Deep water Niche: shoreline and shallow water
SHOALS-1000T Sensor • 1-kHz hydro laser • 4 mJ @ 532 nm • 3 mJ @ 1064 nm • 9-kHz topo laser • 6 uJ @ 1064 nm • 4-channel receiver • 10 cm aperture
SHOALS-1000T Consoles Power Distribution Laser Power Supply Laser Electronics Laser Chiller 18” LCD Display MirroredRHDs Compact Flash (OrFloppyDrive)
4 Waveforms per Pulse IR Surface Raman APD Green PMT Green
Performance Characterization Depth Measurement Accuracy Underwater Horizontal Accuracy Depth Penetration
Measurement Rate - - hydro - topo Measurement Depth Depth Penetration Operating Altitude Aircraft Speed Laser Spot Spacing Swath Width Measurement Accuracy Airborne System Weight 1000 Hz 9 kHz 50 m kD > 3 (daytime) 200 - 400 m 125 - 175 knots 2x2, 3x3, 4x4, 5x5 m up to 0.58 x altitude IHO Order 1 210 kg SHOALS 1000T Specifications
Extinction depth = 39m 11 3 1 2 10 4 9 5 6 7 8
Acoustic depths – SHOALS depths 10386 points; mean difference = 0.145m; sigma = 0.188m
IHO-1 Depth Accuracy (95% confidence) 1.00 0.90 0.80 0.70 0.60 0.50 0.40 0.30 0.20 0.10 0.00 0 10 20 30 40 50 Depth (m)
Underwater Horizontal Accuracy Ten 2x2x2 m cubes were placed in the project area
Underwater Horizontal Position Accuracy • Example waveform for 2m cube in 26m depth
Multiple detections of a 2m cube at 18m depth • Grid is 1m x1m • Yellow and Black squares are averages of 14 eastbound and westbound flights • Separation of averages is 1.3 meters eastbound westbound Avg eastbound Avg westbound
Depth Penetration Test Courtesy of Viktor Feigels (Optech Int.) and Alan Weideman (NRL)
Extinction depth = 39m Diffuse Attenuation Coefficient: Kd = 0.09 m-1 Extinction Depth = 39m Kd * D = 3.5
Beyond Safety of Navigation Auto-extraction of shoreline Topo/bathy datasets SHOALS seafloor images (pseudoreflectance) 3d Benthic mapping and water column data
MHW Shoreline MLLW Shoreline Shoreline Mapping is a 3-D problem Private uplands Inland Waters; Tidelands Territorial Seas; EEZ; and High Seas
LIDAR-derived MHW Shoreline (ALTM) Seal Rocks ( Courtesy of Jason Woolard at NOAA/NGS )
Topo/bathy datasets Ft. Lauderdale Beach Front
44 flightlines 13 Km x 3 Km 6.8 M points APD/PMT merged at 12 m 5.0 m pixels Max D = 37 m
Laser Data Spectral Data Active/Passive Fusion 3D Coastal Landcover and Benthic information Water column information + =
Lls Llb rl SHOALS-1000TH Lla D, r
Spatial Variation in Water Column Homogeneous areas in SHOALS pseudoreflectance CASI-2 L534water CASI-2 K534
Spectrometer r534 SHOALS r532 DEPTH Signal level fusion yields 3 data sets for classification
SHOALS r532 waveforms Llbottom waveforms SHOALS depth rl FUSION Processor kl radiance waveforms Llwater spectrometer SHOALS Fusion Software
3-d Benthic Habitat Mapping Orange = Sand Green = Seagrass Violet = Uncolonized Pavement Yellow = Colonized Pavement Brown = Macroalgae (50-90%) Blue = Macroalgae (10-50%) Black = Not Classified
UAV 3D Environmental Mapping Higher Resolution Evolution of SHOALS SHOALS-T