Download
1 / 53
550 likes | 663 Views
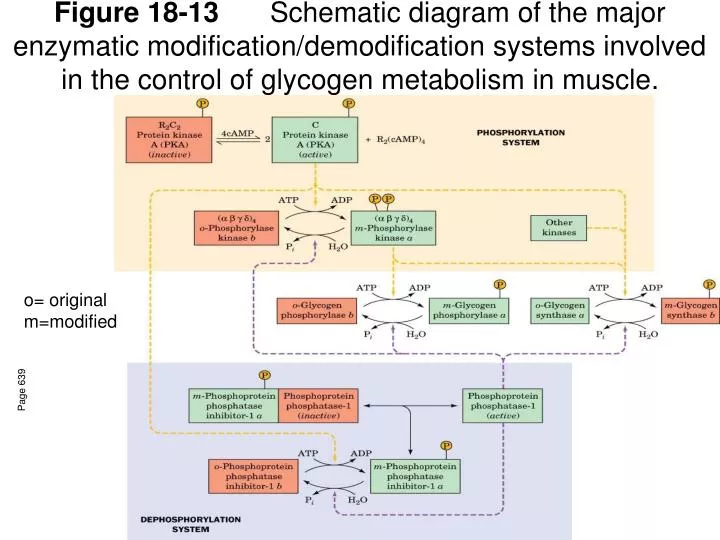
Figure 18-13 Schematic diagram of the major enzymatic modification/demodification systems involved in the control of glycogen metabolism in muscle. o= original m=modified. Page 639.

E N D
Figure 18-13 Schematic diagram of the major enzymatic modification/demodification systems involved in the control of glycogen metabolism in muscle. o= original m=modified Page 639
Candace Parchen (BS Cell Molec. Biol. 2004) will give the Biology seminar next Wednesday 2/10 (4pm in BI 234). Title: The Effect of Phosphodiesterase 5 (PDE5) inhibitors on Dystrophic Hearts Annual T-shirt contest is underway. Strut your geeky stuff!!!!!
Figure 18-14X-ray structure of the catalytic (C) subunit of mouse protein kinase A (PKA). ATP inhibitor Page 641 PKs have KEY roles in signalling 1.7% of human genome = kinases 1000 putative kinase genes!
Figure 18-15 X-ray structure of the regulatory (R) subunit of bovine protein kinase A (PKA). Autoinhibitory domain Fits in active site of C Keeps complex inactive Page 641
Phosphorylase Kinase • Senses Ca+2 • Activated by [Ca+2] as low as 10-7M!! • 4 subunits (αβγδ)4 active structure a tetramer of tetramers! • Subunit γ has catalytic activity • Others are inhibitory • Subunit δ = Calmodulin (CaM)
Figure 18-16 X-Ray structure of rat testis calmodulin. Ca+2 binding induces a conformational change exposing a met-rich hydrophobic region. 4 binding sites for Ca+2 Flexible stalk May be random coil really Page 642 Nerve impulses into muscle trigger Ca+2 release Why would increased [Ca+2 ]promote glucose mobilization?
methionine sulfur atoms key nonpolar areas The non-polar amino acids form two neat grooves (red stars) when calcium binds,. Because these non-polar grooves are generic in shape, calmodulin acts as a versatile regulatory protein and its targets are not required to possess any specific amino acid sequence or structural binding motifs. In phosphorylase kinase, CaM-Ca+2 binds strongly to the γ subunit and increases its activity.
Figure 18-17 EF hand, the calcium binding site. Octahedral geometry for Ca+2 Page 642
Figure 18-18a. NMR structure of (Ca2+)4–CaM from Drosophila melanogaster in complex with its 26-residue target polypeptide from rabbit skeletal muscle myosin light chain kinase (MLCK). (a) A view of the complex in which the N-terminus of the target polypeptide is on the right. Page 643 Target peptide
Figure 18-18b. NMR structure of (Ca2+)4–CaM from Drosophila melanogaster in complex with its 26-residue target polypeptide from rabbit skeletal muscle myosin light chain kinase (MLCK). (b) The perpendicular view as seen from the right side of Part a. Page 643
Figure 18-19 Schematic diagram of the Ca2+–CaM-dependent activation of protein kinases.
Figure 18-21 The antagonistic effects of insulin and epinephrine on glycogen metabolism in muscle. Phosphoprotein phosphatase 2 Mn+2 activate water for nucleophillic attack Page 645
Maintaining steady blood [glc] Figure 18-22 The enzymatic activities of phosphorylase a and glycogen synthase in mouse liver in response to an infusion of glucose. Hi [glc] stimulates insulin secretion Low [glc] stimulates glucagon secretion Page 648
Figure 18-23 Comparison of the relative enzymatic activities of hexokinase and glucokinase over the physiological blood glucose range. NOT inhibited by G6P Page 649
Figure 18-24 Formation and degradation of -D-fructose-2,6-bisphosphate as catalyzed by PFK-2 and FBPase-2. Page 649 These 2 activities are located on 2 different domains of the same protein! PKA is a ser kinase It decreases PFK activity and increases FBPase activity.
Glucoagon Action in Liver vs. Muscle Liver • ↑cAMP • ↑PKA • ↓[F2,6BP] • glycolysis↓ • Muscle • ↑ Glycogen breakdown • ↑glycolysis HUH??? --Different isozymes --Different phosphorylation sites --Different Kinetics!!!
Figure 18-25 X-ray structure of the H256A mutant of rat testis PFK-2/FBPase-2. PFK 2 Page 650 FBPase
Figure 18-26b The liver’s response to stress. (b) The participation of two second messenger systems. Page 652
Figure 18-26a The liver’s response to stress. (a) Stimulation of α-adrenoreceptors by epinephrine activates phospholipase C to hydrolyze PIP2 to IP3 and DAG. Page 652
Fig. 19-16 Receptor-mediated activation/inhibition of Adenylate Cyclase
Figure 19-13 Activation/deactivation cycle for hormonally stimulated AC. Page 674
Figure 19-14 General structure of a G protein-coupled receptor (GPCR). Page 674
Figure 19-51 Role of PIP2 in intracellular signaling. Page 708
Figure 19-21 Schematic diagram of a typical mammalian AC. Page 682
Figure 19-50 Molecular formula of the phosphatidylinositides. Page 707
Figure 19-52 A phospholipase is named according to the bond that it cleaves on a glycerophospholipid. Page 709
Figure 19-57 Activation of PKC. Page 713
Figure 18-27 The ADP concentration in human forearm muscles during rest and following exertion in normal individuals and those with McArdle’s disease. (Muscle Phosphorylase Deficiency) Page 653
For diffusion Keq = 1, thus DG°’ = 0 Start of “reaction” equilibrium
“non-mediated” transport
a-hemolysin (Staph. aureus) “IONOPHORES” Gramicidin A See Figure 20.11