Download
1 / 37
370 likes | 374 Views
Chapter 6 The Human Population and Its Impact. 6-1 How Many People Can the Earth Support?. Concept 6-1 We do not know how long we can continue increasing the earth’s carrying capacity for humans without seriously degrading the life-support system that keeps us and many other species alive.

E N D
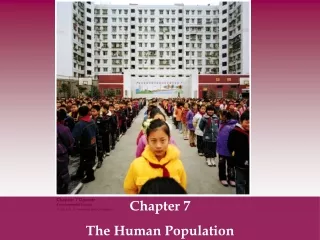
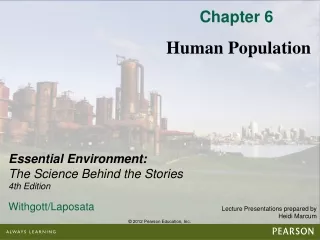
Chapter 6 The Human Population and Its Impact
6-1 How Many People Can the Earth Support? • Concept 6-1 We do not know how long we can continue increasing the earth’s carrying capacity for humans without seriously degrading the life-support system that keeps us and many other species alive.
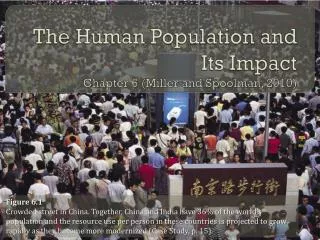
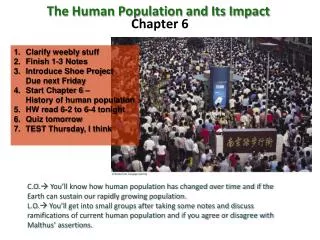
Crowded Street in China Fig. 6-1, p. 125
Human Population Growth Continues but It Is Unevenly Distributed (1) • Reasons for human population increase • Movement into new habitats and climate zones • Early and modern agriculture methods • Control of infectious diseases through • Sanitation systems • Antibiotics • Vaccines • Health care • Most population growth over last 100 years due to drop in death rates
Human Population Growth Continues but It Is Unevenly Distributed (2) • Population growth in developing countries is increasing 9 times faster than developed countries • 2050 • 95% of growth in developing countries • 7.8-10.8 billion people • Should the optimum sustainable population be based on cultural carrying capacity?
Human Population Growth Fig. 1-18, p. 21
Population Time Line: 10,000 BC - 2042 Figure 3, Supplement 9
Annual Growth Rate of World Population, 1950-2010 Fig. 6-2, p. 127
Where Population Growth Occurred, 1950-2010 Fig. 6-3, p. 127
Five Most Populous Countries, 2010 and 2050 Fig. 6-4, p. 127
Science Focus: Projecting Population Change • Why range of 7.8-10.8 billion for 2050? • Demographers must: • Determine reliability of current estimates • Make assumptions about fertility trends • Deal with different databases and sets of assumptions
Science Focus: How Long Can The Human Population Keep Growing? • Thomas Malthus and population growth: 1798 • Overpopulation and overconsumption • Will technology increase human carrying capacity? • Can the human population grow indefinitely?
Natural Capital Degradation: Altering Nature to Meet Our Needs Fig. 6-B, p. 129
The Human Population Can Grow, Decline, or Remain Fairly Stable • Population change • Births: fertility • Deaths: mortality • Migration • Population change = (births + immigration) – (deaths + emigration) • Crude birth rate: # live births/1000/year • Crude death rate: # deaths/1000/year
Women Having Fewer Babies but Not Few Enough to Stabilize the World’s Population • Fertility rate • number of children born to a woman during her lifetime • Replacement-level fertility rate • Average number of children a couple must have to replace themselves • 2.1 in developed countries • Up to 2.5 in developing countries • Total fertility rate (TFR) • Average number of children born to women in a population
Total fertility rate, 1955-2010 Fig. 6-5, p. 130
2010 Rate of Population Increase Figure 11, Supplement 8
Total Fertility Rate Figure 12, Supplement 8
Case Study: The U.S. Population Is Growing Rapidly • Population still growing and not leveling off • 76 million in 1900 • 310 million in 2010 • Drop in TFR in U.S. • Rate of population growth has slowed • Changes in lifestyle in the U.S. during the 20th century
U.S. TFRs and birth rates 1917-2010 Fig. 6-6, p. 131
20th Century Lifestyle Changes in the U.S. Fig. 6-7, p. 132
Several Factors Affect Birth Rates and Fertility Rates (1) • Children as part of the labor force • Cost of raising and educating children • Availability of private and public pension • Urbanization • Educational and employment opportunities for women
Several Factors Affect Death Rates (1) • Life expectancy • Infant mortality rate • Number of live births that die in first year • Why are people living longer? • Increased food supply and distribution • Better nutrition • Medical advances • Improved sanitation
Several Factors Affect Death Rates (2) • U.S. is 54th in world for infant mortality rate • U.S. infant mortality rate high due to • Inadequate health care for poor women during pregnancy and their infants.
Infant Mortality Rates, 1950-2010 Fig. 6-10, p. 134
Infant Mortality Rates in 2010 Figure 13, Supplement 8
Migration Affects an Area’s Population Size • Economic improvement • Religious freedom • Political freedom
Legal Immigration to the U.S. between 1820 and 2006 Fig. 6-11, p. 135
A Population’s Age Structure Helps Us Make Projections • Age structure categories • Prereproductive ages (0-14) • Reproductive ages (15-44) • Postreproductive ages (45 and older) • Seniors are the fastest-growing age group
Generalized Population Age-Structure Diagrams Fig. 6-12, p. 136
Population Structure by Age and Sex in Developing and Developed Countries Fig. 6-13, p. 136
Tracking the Baby-Boom Generation in the United States Fig. 6-14, p. 137
Some Problems with Rapid Population Decline Can threaten economic growth Labor shortages Less government revenues with fewer workers Less entrepreneurship and new business formation Less likelihood for new technology development Increasing public deficits to fund higher pension and health-care costs Pensions may be cut and retirement age increased Fig. 6-15, p. 138
As Countries Develop, Their Populations Tend to Grow More Slowly • Demographic transition • First death rates decline • Then birth rates decline • Four stages • Preindustrial • Transitional • Industrial • Postindustrial
Four Stages of the Demographic Transition Fig. 6-17, p. 140
TFR in Bangladesh and U.S., 1800-2010 Fig. 6-18, p. 140
Case Study: Slowing Population Growth in India • 1.2 billion people, most populous country in 2015 • Problems • Poverty • Malnutrition • Environmental degradation • Bias toward having male children • Poor couples want many children