Download
1 / 61
610 likes | 770 Views
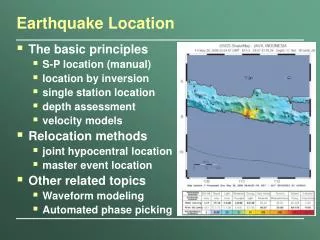
Uncertainty of location and multiple-point source model of M 7.1 Van earthquake, Turkey, 2011. J. Zahradnik 1 , E. Sokos 2 , J. Jansky 1 , V. Plicka 1 1) Charles University in Prague, Czech Republic 2) University of Patras, Greece. Mw 7.1 (USGS) October 23, 2011.

E N D
Uncertainty of location and multiple-point source model of M 7.1 Van earthquake, Turkey, 2011 J. Zahradnik1, E. Sokos2, J. Jansky1, V. Plicka1 1) Charles University in Prague, Czech Republic 2) University of Patras, Greece
Mw 7.1 (USGS) October 23, 2011
Problems: VMUR a TVAN clipped in S, other stations - unclear S-onsets Turkish SM 6503, 4902 and Iranian SM stations with no absolute time
NLL depth histogram “P&S” epic. 38.7163 43.4045 depth 8.1 km origin time 10 41 21.22 ERH 1.7, ERZ 2.0
NLL depth histogram In contrast to ~ 1 km conventional estimates, hypocenter uncertainty is ~ 5 km. Therefore: It should not be used to constrain the slip models (as many people do…).
How efficient is the location when using just seven nearest SM stations of the Turkish network? The answer comes from the Source Scanning Algorithm (Kao et al. with our modification). See our POSTER today, Aug. 20 DAP5: P102 Janský et al.
LAT (km) With 6503 LON (km) Without 6503
With 6503 Without 6503
With 6503 Without 6503
bad good With 6503 Without 6503
The seven nearest SM stations efficiently locate the event by the SSA back-projection; station 6503 is important. So far, this role of SSA to assess location uncertainty (including ‘data and modeling errors’) has not been fully recognized. See our POSTERtoday, Aug. 20 DAP5: P102 Janský et al.
SSA can also automatically check the consistency between the data and the Vp, Vs crustal model. blue = P-wave stack, pink = S-wave stack
SSA can also automatically check the consistency between the data and the Vp, Vs crustal model. We suggest the correlation between the P- and S-stack to measure quality of the location.
On the other hand – temporal evolution of the SSA (brightness maps) should be considered with great caution.
Focusing of the brightness should not be misinterpreted as the rupture propagation effect.
Part 2 – centroid momenttensorepic. distances 330-1290 km periods 100-200 seconds
Deviatoric solution, Variance Reduction = 0.83 a strongly dominant single point source, strike/dip/rake = 246°, 52°, 75°, DC>90% grid search: 38.689°N, 43.351°E; no depth resolution
Part 3 – major subevent(decreasing period to reveal possible source complexity) Seven Turkish strong-motion stationsepic. distances ~40 -220 kmperiods 10-20 seconds ISOLA software (Sokos and Zahradnik, 2008) News in our talk tomorrow, Aug. 21 ORAL, DAP1+4 O24 14:45-15:00
Six CMG-5TD’s, while 6503 was equipped with an old SigSa smach accelerograph. But, as shown above, we need 6503… Excellent data availability from TR-KYH
Instrumental parametersfor Smach (6503) were provided by GeoSig:
The deviatoric inversion couldn’t be used at these shorter periods, because it produced a very large (> 50%) spurious non-DC component due to the finite-extent source effect.Instead – we used the CMT (BB) double-couple mechanism and grid-searched the major subevent: 38.734°N, 43.351°E Inversion from seven SM’s. Isolines showing the waveform match:
The deviatoric inversion couldn’t be used at these shorter periods, because it produced a very large (> 50%) spurious non-DC component due to the finite-extent source effect.Instead – we used the CMT (BB) double-couple mechanism and grid-searched the major subevent: 38.734°N, 43.351°E Inversion from seven SM’s. Isolines showing the waveform match: Major subevent at ~2-5 km west of hypocenter.
Keeping fixed the DC focal mechanism from the BB solution, and making grid search over depth, we arrived at clear preference of the depths > 10km of the major subevent. (More details, 10-20 km unresolved).
Alternatively, we calculated the DC-constrained solution (by Lagrange multipliers) and found the same position of the major subevent at 38.734°N, 43.351°E, with strike/dip/rake= 238°, 55°, 63°.
Part 4 – any additional subevents ? shortest periods further decreased to 6 seconds
How to constrain the fault plane? We used a fault plane of the strike/dip/rake angles obtained from the BB data (246°, 52°, 75°), passing through the reference point defined by Lat, Lon coordinates of the major subevent (38.734°N, 43.351°E) and with the depth fixed at 15 km. Reason? Major subevent and P&S hypocenter represents the H-C consistent solution [Zahradnik et al., SRL 2008].
MPS(multiplepoint source) scale: Radii of circles proportional to moment. Color refers to rupture time. Software: New ISOLA. Our talk tomorrow, Aug. 21 DAP1+4 O24 14:45-15:00
Two source contributions are dominant. scale: 1 2
Two source contributions are dominant. Nevertheless, the nearest station 6503 required at least one or two (smaller) subevents. scale: 4 3
scale: Note that ‘the earliest’ subevent (#3) is close to epicenter (star). 4 3
Part 5 – stability and uncertainty of the MPS solution periods > 6 seconds
To check stability we enlarged the fault and perturbed the MPS solution. Perturbation = forcing subevent #1 to be in a prescribed trial position e.g. 17, 18, 19. 17 19 18
Common features: (i) the solution is relatively concentrated in the central part of the fault (ii) one of the two largest subevents is always delayed by some 3 s, and is situated more towards SW (in the strike direction) (iii) the earliest subevent turquoiseis small, and it is situated near the largest subevent and near epicenter (iv) the solutions always contain also a small very latepinksubevent, but the position and time of this source contribution is unstable 17 19 18
Analogous solution in case of an artificially damped moments (while increasing number of subevents) 26.8 km => 3.2 km The overall (summed) moment has almost the same spatial distribution.
Comparison with standard slip inversion (Gavin Hayes, USGS NEIC)
Comparison with satellite interferometry by Elisa Trasatti INGV-Rome.
Comparison ofISOLA (green)with TSVDslip inversion(by F. Gallovič) POSTER today, Aug. 20. RSE1: P007 Ameri et al. animace
Conclusion • Significantly poorer station coverage compared to e.g. L’Aquila 2009 results in less certain results. • We passed from a single source (100-200 s) to multiple-source solution (6-20 s). • Our solution was constructed independently of the uncertain H, but finally reached H-C consistency. • Source consisted of at least 3 episodes. • Further work: GPS and high-frequency SM modeling (see poster of G. Ameri et al.)
Conclusion • Significantly poorer station coverage compared to e.g. L’Aquila 2009 results in less certain results. • We passed from a single source (100-200 s) to multiple-source solution (6-20 s). • Our solution was constructed independently of the uncertain H, but finally reached H-C consistency. • Source consisted of at least 3 episodes. • Further work: GPS and high-frequency SM modeling (see poster of G. Ameri et al.)
Strike Dip Rake 238. 55. 63. 250. 55. 63. 261. 55. 63. => Směr šipek určen mechanismem (možná kromě MURA), délka pak rozložením skluzu; u L’Aquily pro stanice nad zlomem složitější!