Download
1 / 50
500 likes | 608 Views
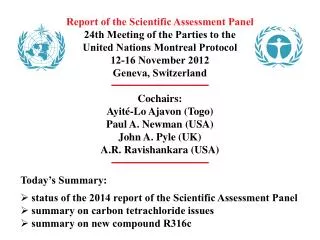
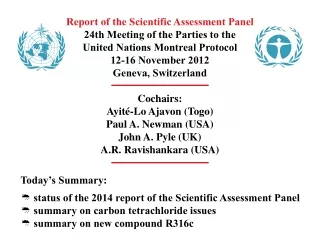
Synthesis Report of the Scientific Assessment Panel (SAP) Environmental Effects Assessment Panel (EEAP) Technology and Economic Assessment Panel (TEAP) 31 st Meeting of the Open-Ended Working Group of the Parties to the United Nations Montreal Protocol 1–5 August 2011 Montreal, Canada.

E N D
Synthesis Report of the Scientific Assessment Panel (SAP) Environmental Effects Assessment Panel (EEAP) Technology and Economic Assessment Panel (TEAP) 31st Meeting of the Open-Ended Working Group of the Parties to the United Nations Montreal Protocol 1–5 August 2011 Montreal, Canada Today’s Summary: Synthesis Report Findings
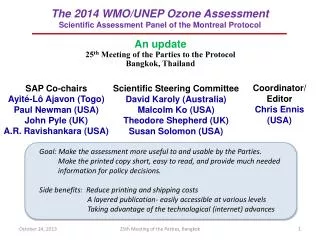
The Synthesis Report Team Co-chairs:Coordinator: Ayité-Lô Ajavon (Togo) Christine A. Ennis (USA) Paul A. Newman (USA) John A. Pyle (UK) A.R. Ravishankara (USA) SAP Co-chairs: Janet F. Bornman (New Zealand) Nigel D. Paul (UK) Xiaoyan Tang (China) EEAP Co-chairs: Stephen O. Andersen (USA) Lambert J.M. Kuijpers (The Netherlands) Marta Pizano (Colombia) TEAP Overall Assistance and Coordination: Megumi Seki (UNEP)
The Assessments • The SAP, EEAP, and TEAP Assessment Reports were published in early 2011 • All reports were fully reviewed by the international community • The Synthesis Report was prepared in June 2011 and summarizes key findings of all 3 assessment reports
Overarching Synthesis Findings of the SAP, the EEAP, and the TEAP • Stratospheric Ozone and Climate: Intricately coupled. • Ozone as well as ODSs impact climate, and both are impacted byclimate. • Hence, it may be prudent to consider ozone layer and climate protection together for various decision making. • The magnitudes of the consequences of climate-ozone interactions for health, biodiversity, ecosystem function and feedbacks are currently uncertain. • Hydrofluorocarbons: Alternatives with lower GWPs are emerging. • HFCs have low ODPs but high GWPs. If unabated, they could grow to become 20% of all GWP-weighted GHG emissions by 2050. • It is technically and economically feasible to accelerate the phase-out of ODSs, to phase down the use of high-GWP HFCs, and to leapfrog the use of high-GWP HFCs as alternatives for most HCFC applications. • Breakdown products from HFC and HCFC uses, such as trifluoroacetic acid (TFA), are not expected to be a significant risk to health or the environment. • Methyl Bromide: Further control is still possible. • For example, approximately 20–35% of present global consumption of methyl bromide for quarantine and pre-shipment (QPS) uses could be replaced with available alternatives.
The Science Panel Report: Key Findings The Full Report The Executive Summary
Key Findings of the SAP Let us look at these individually….. ODSs are behaving as expected ODSs Climate change and ozone layer are intricately coupled. Climate change will become more important. MP can potentially influence climate Climate Change Ozone hole continues to persist, as expected. It is expected to recover later this century. Ozone hole Global ozone depletion is smaller than the ozone hole. It has not gotten worse because of the MP. Expected to recover towards the middle of this century. Global ozone Surface UV changes are small to date. In the future, it will be influenced by climate change more than ozone depletion. Global UV Change
Ozone-Depleting Substances (ODSs) The abundances of ODSs in the atmosphere are responding as expected to the controls of the Montreal Protocol. • Total chlorine from ODSs continues to decline in both the lower atmosphere and the stratosphere. • CFCs (not methyl chloroform) now contributing most to the chlorine decline. • Total bromine from ODSs is declining in the lower atmosphere and is no longer increasing in the stratosphere. • For the first time, the global atmospheric abundance of bromine from halons stopped increasing, and halon-1211 actually declined. • Abundances of most HFCs and HCFCs are growing in the atmosphere. Some HCFCs (e.g., HCFC-22, HCFC-142b) increased faster than expected during the past four years.
Carbon Tetrachloride Chapter 1, Figure 1-5, 2010 SAP Report Chapter 1, Figure 1-1, 2010 SAP Report 300 250 200 150 100 50 0 110 105 100 95 90 85 NOAA data Global Surface Mixing Ratio (ppt) Emission or Production (Gg/yr) AGAGE data Scenario A1 2006 Assessment • 1990 1995 2000 2005 2010 • Year • CCl4 continues to decrease in the atmosphere, but its abundance is not consistent with reported emissions and known lifetimes. • Emissions derived from data reported to UNEP are highly variable and on average appear smaller than those inferred from observed trends. • Although the size of this discrepancy is sensitive to uncertainties in our knowledge of CCl4 lifetime, the variability cannot be explained by lifetime uncertainties alone. • Errors in reporting, errors in analysis of reported data, and/or unknown sources are likely responsible for the year-to-year discrepancies. 1990 1995 2000 2005 2010 Year
The Ozone Layer and Climate Change The ozone layer and climate change are intricately coupled, and climate change will become increasingly more important to the future ozone layer. Increasing abundances of radiatively important gases, especially carbon dioxide(CO2) and methane (CH4), are expected to significantly affect future stratospheric ozone through effects on temperature, winds, and chemistry. For the next few decades, the decline in ODSs will dominate the recovery of the ozone layer. As ODSs decline, climate change and other factors are expected to become increasingly more important to the future ozone layer. Ozone levels globally and at midlatitudes may even become larger than those before 1980.
Antarctic Ozone Hole • The ozone hole that occurs in austral springtime is projected to recover later in the century than any other region of the globe. • The Antarctic ozone hole is much less influenced by climate change than other areas of the globe. • ODSs primarily determine when the ozone hole will heal.
Arctic vs. Antarctic Ozone Chapter 2, Figure 2-14, 2010 SAP Report • Many factors control ozone depletion • Meteorology • Temperature in specific regions • Available EESC • Formation of vortex and “pre O3 value” • Duration, shape, and movement of vortex • “Saturation” in Antarctica vs. not in Arctic • Key Point: • Confluence of natural and human emitted ODS contribute to ozone depletion…. so variations in the “natural” part can have major effect • Differences between ozone hole and Arctic Depletion are expected. • Arctic ozone depletion at its maximum does not exceed that in the ozone hole.
The Global Ozone Layer • Control of ODSs by the Montreal Protocol has protected the ozone layer from much higher levels of depletion. • Globally, the ozone layer is projected to recover to its 1980 level before the middle of this century.
Surface Ultraviolet Radiation The ozone layer and surface ultraviolet (UV) radiation are responding as expected to the ODS reductions achieved under the Montreal Protocol. • Global surface UV levels have not increased significantly because the global ozone loss has been limited. • If there were no MP, the surface UV levels would have been large • Factors other than stratospheric ozone will determine surface UV levels in the future.
Montreal Protocol and Climate MP benefited climate change via control of ODSs, which are also greenhouse gases. Figure from Executive Summary and Chapter 5, Figure 5-6: • Co-benefits of Montreal Protocol for climate: • D ODS ≈ 5 x D CO2 (of the first commitment period of the Kyoto Protocol).
HCFCs, HFCs, and PFCs Chapter 1 , Figure 1-24, 2010 SAP Report • HCFCs are “transitional” substitutes. However, they are still increasing rapidly. • Effects of 2007 agreements on HCFCs are not yet visible • HCFCs are being replaced by HFCs (climate effect) • PFCs, which are “eternal gases” and, hence, very potent greenhouse gases, are increasing rapidly.
Other Information • The accelerated HCFC phase-out agreed to in 2007 is projected to reduce ozone depletion and to help reduce climate forcing. • New fluorocarbons, suggested as possible replacements for HCFC and HFC that are potent greenhouse gases, are less potent greenhouse gases. • Nitrous oxide (N2O) is known to both deplete global ozone and warm the climate. The current ODP-weighted anthropogenic emission is larger than that of any ODS. • Geo-engineering: Deliberate large injections of sulfur-containing compounds into the stratosphere would alter the radiative, dynamical, and chemical state of the stratosphere and could be expected to have substantial unintended effects on stratospheric ozone levels.
The impact of ozone hole on surface climate has become more evident. There are many influences on climate from the ozone hole. • The Antarctic ozone hole has caused wind pattern changes in the Southern Hemisphere lower atmosphere. • Because of these changes, for example, the surface climate has warmed over the Antarctic Peninsula and cooled over the high plateau. Ozone Hole and Surface Climate
Options and Expected Gains Chapter 5 , Figure 5-2, 2010 SAP report • Options for further limiting future emissions of ODSs could advance recovery dates by a few years; • However, the impact these potential emission reductions on future ozone levels would be less than what has already been accomplished by the Montreal Protocol. (Make sure that emissions do not go up! and possible actions on HFCs) • Report lists some specific options and expected gains.
The EEAP Report: Environmental Effects Findings Consequences of Ozone Layer Depletion and Climate Change on UV-radiation Air qualityMaterials HealthTerrestrial ecosystemsAquatic ecosystemsBiogeochemical cycles Janet F. Bornman (New Zealand), Nigel Paul (UK), Xiaoyan Tang (China)
Consequences of Ozone Layer Depletion and Climate Change on UV-radiation Overview Assessment of future predictions of the effects of ozone, clouds & aerosols for: UV-B radiation deleterious to human health UV-B radiation involved in human vitamin D production Ecosystem function, air quality, and damage to construction materials
Ozone depletion, climate change, and UV radiation Projected future changes in UV: ozone and clouds At low latitudes (near the equator): cloud cover decreases by ca 3% Increase in UV radiation (UV already high) At high latitudes: cloud cover increases (by ca 5%) Reduction of UV radiation (UV already low) Greater risk of skin cancer: additional increase in sunburning-UV of 3 to 6% Less risk of skin cancer and less easy to produce sufficient vitamin D
Tropospheric air quality Assessment of the interactive effects of ozone depletion and other components of environmental change on air quality, human health and ecosystems Surface (tropospheric) ozone in mid-latitudes is predicted to increase because of climate change and interactions with atmospheric chemistry Breakdown of CFC replacements: Trifluoroacetic acid (TFA): currently judged as a negligible risk to human health or the environment
Tropospheric air quality • UV initiates production of hydroxyl radicals (∙OH), which are atmospheric ‘cleaning agents,’ destroying many air pollutants, ODS, photochemical smog • With ozonerecovery, less UV; as a result ∙OH is predicted to decrease globally by ca 20% by 2100 Potential for increased photochemical smog, with negative effects on human health and the environment
Materials Assessment of combined effects of UV radiation and climate change on construction materials used outdoors UV radiation degradation of plastics & wood Damage due to high temperatures, humidity, & atmospheric pollutants Assessed availability of protective technologies: Improved service lifetimes of materials Use of plastic nanocomposites & wood-plastic composites; nanomaterials as stabilisers
Human health Assessment of the effects of UV radiation, and interactions with other environmental change, on human health include: Skin and eye diseases (especially cancers) Immune responses Vitamin D production • Higher temperatures may lead to more skin cancers • Also indications for increases in certain infectious diseases, allergic diseases, suppression of immune response to disease, & photosensitivity of the skin
Human health Exposure to sun-burning UV-B radiation* is a major environmental risk for skin cancers Cutaneous malignant melanoma The Montreal Protocol has PREVENTED large increases in skin cancers that would have resulted from uncontrolled ozone depletion ALTHOUGH incidence currently is high Squamous cell carcinoma Non-melanoma Basal cell carcinoma M. Norval *UV-B radiation, 280-315 nm
Human health Need to balance the risks of over-exposure to UV radiation with the beneficial effects of vitamin D production Vitamin D is produced in the skin following UV-B irradiation May decrease risk of: - several internal cancers - autoimmune & infectious diseases - cardiovascular diseases Supports bone health Effectiveness of oral vitamin D supplements, and the health effects of very high vitamin D status are both unclear
Terrestrial and aquatic ecosystems Assessment of the effects of changes in UV radiation, and interactions with other environmental change on: Food security & food quality Ecosystem responses to UV radiation & climate • Terrestrial plant growth has been reduced by ca 6% in response to increased UV radiation in areas of significant ozone depletion. • In many areas, vulnerable aquatic organisms have been exposed to increased UV radiation.
Terrestrial and aquatic ecosystems Combined effects of predicted climate change & UV radiation: plants and ecosystems Moderate drought: decreases UV sensitivity in plants More frequent drought & rising temperatures reduce productivity Changing UV-B radiation: large effects on plant interactions with pests because of induced chemical compounds. Increasing temperature, rainfall lead to spread of plant pests Implications for food security and quality
Terrestrial and aquatic ecosystems Combined effects of predicted climate change and UV radiation in aquatic systems Increasing CO2 Increases acidity (low pH) Decreases skeletal formation in calcified organisms Increased vulnerability to solar UV‐B radiation Increasing temperature increases breakdown of dissolved organic material More exposure of aquatic organisms to solar UV-B Combined effects may exceed capacity of protective strategies to adapt to UV radiation
Carbon and other global chemical cycles Increased run-off of organic matter from land into the oceans Negative effects of climate change & UV radiation on aquatic organisms UV-induced breakdown of this organic matter Decreased CO2 uptake by the oceans • Increased CO2 emissions from the oceans (also increased NOx ) Resulting increase in atmospheric CO2 may force global warming beyond current predictions
Carbon and other global chemical cycles Ecosystem responses to interactions between UV radiation and climate change will affect global chemical cycles
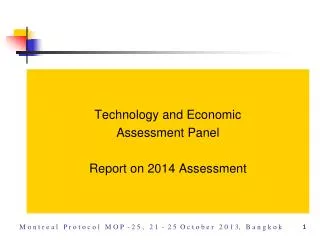
The TEAP Report: Key Findings Stephen O. Andersen Lambert Kuijpers Marta Pizano
It is Technically and Economically Feasible: To accelerate the phase-out of most ODSs To reduce emissions in many applications To collect and destroy large amounts of ODSs To phase-down the use of high-GWP HFCs in mobile air conditioning and other applications where ODS have already been phased-out To stimulate new technology by implementing HFC controls to protect climate
Rapidly Emerging Technology to Avoid & Replace High-GWP HFCs Until recently, there were few economic incentives to avoid and eliminate HFC use and emissions, where environmentally superior alternatives are available Presently, low-GWP alternatives are being introduced for most sectors The substance with the lowest GWP will not protect the climate if manufacturing and energy use dominates the carbon footprint
Actions to Reduce Radiative Forcing of Climate Change European Commission MAC Directive prescribing GWP<150 in all new cars by 2017 U.S. EPA “Un-SNAPing” HFC-134a in new cars Up to 25% higher MLF financing for climate friendly solutions Proposals by Micronesia and by Mexico, Canada, and the United States for an Amendment to control HFC consumption and production under the Montreal Protocol
Methyl Bromide QPS Opportunity There is no obligation or incentive under the Montreal Protocol to limit methyl bromide quarantine and pre-shipment (QPS) uses or emissions Nevertheless, some Parties have entirely phased out QPS uses of MB and others are committed to phaseout in the near future 20-35% of present global use can be replaced with alternatives available today
Technology Not Yet Available for Important ODS Uses • Some metered-dose inhalers (MDIs) and laboratory and analytical uses still depend on new production of ODSs under essential use exemptions • Some important uses still depend on banked and recycled ODS • Fire protection depends on halons, refrigeration and air conditioning service depends on HCFCs and some CFCs, and minor other uses depend on a variety of ODSs
Increased Financing Would Slow Climate Change & Further Protect Ozone Article 5 Parties can go beyond Montreal Protocol compliance by avoiding high-GWP HFCs in the HCFC phaseout and in applications where the ODS phaseout is complete can phase down high-GWP HFCs and increase the energy efficiency in refrigeration, air conditioning and foam applications
Leapfrog Technology is Available In Some Applications Technology is available for Article 5 Parties to leapfrog high-GWP HFCs in some applications, which would avoid a second transition out of HFCs and complications of an increasingly large inventory of HFC equipment requiring servicing with HFCs that may be expensive or not easily available The same technology is available for non-Article 5 Parties to make the transition away from high-GWP HFCs in a new transition Adequate financing will be needed for Article 5 Parties and regulatory incentives will be required for non-Article 5 Parties
Banked ODS are Leaking Away • The opportunity to destroy unwanted ODS refrigerants is leaking away as equipment reaches end-of-life and ODSs are discharged • The co-benefits of ozone and climate protection from collecting and destroying ODSs likely exceed the costs • Not profitable without payment for environmental benefit • More profitable if enterprises were paid for the contribution to ozone and climate protection • Economic incentives and infrastructure are not available in most developing and developed countries • It is counter-productive to compel collection and destruction without incentives, because owners may discharge ODS that would otherwise be available for paid destruction.
The Science Panel Report: What’s in it? • A prologue- a quick way to get up to date on previous assessments • The “terms-of-reference” were decided at the 19th meeting of the Parties in Montreal in September 2007. Key ongoing issues and specific requests included: • Levels and trends of ODS and related chemicals • including N2O, HFCs, further information on the CCl4 budget, and information on very short lived species • Levels of ozone, UV and their trends • Continued improvements in our understanding of the atmospheric science • A general update of science since the 2006 Assessment — 5 scientific chapters • What is new in science • The impact of climate change on ozone layer recovery • The impact of ozone layer changes on climate and its changes
Equivalent Effective Stratospheric Chlorine (EESC) A subtlety: “Actual” effective chlorine levels are different in different regions of the stratosphere Chapter 1, Figure 1-22, 2010 SAP Report for Antarctic springtime Stratosphere, calculated with age-of-air dependent fractional release values for midlatitude stratosphere, calculated with absolute fractional release values for midlatitude stratosphere, calculated with age-of-air dependent fractional release values date of minimum in EESC second derivative • Shows that the levels of “available” effective chlorine is different in different regions of the stratosphere • Shows the differences in the time evolution of effective chlorine in different regions of the stratosphere • Not new! This effect was already taken care of in models! Shown here explicitly.
Ozone Observations Chapter 2, Figure 2-2, 2010 SAP Report • 2010 analyses based mostly on satellite data (importance of satellite data!) • Column ozone trends are as expected in the polar region, high-latitudes, and global levels • No detectable trend in the tropics
Evolution of Stratospheric Chlorine Under the Montreal Protocol Chapter 1, Figure 1-16, 2010 SAP Report • Update of figure from 2006 Assessment- extended for 4 more years. • The trend is clearly - EESC is decreasing and decreasing in the stratosphere with a “lag”- as expected. • Decrease in EESC over time is slower than the build-up: Build-up related mostly to emissions and removal related mostly to ODS lifetimes
Chapter 5 , Figure 5-10, 2010 SAP report Recovery and the World Avoided • Unabated emissions of ODSs at the 1970 levels would have been very detrimental to the ozone layer and, hence, to the surface UV • Note the very large ozone depletions in the tropics and the very large increases in surface UV • Additional consequences to the atmosphere have also been avoided.
Potential for MP to Further Influence Climate? HFCs, which are substitutes for ODSs, do not deplete ozone (ODP = 0) but some of them are potent greenhouse gases Figure from Executive Summary and Chapter 5, Figure 5-6, 2010 SAP report Global warming potentials of HFCs vary a great deal. • Potential role of HFCs: Projected GWP-weighted emissions of HFCs by 2025 ≈ GWP-weighted emissions of CFCs at their peak in 1988.