Download
1 / 17
170 likes | 382 Views
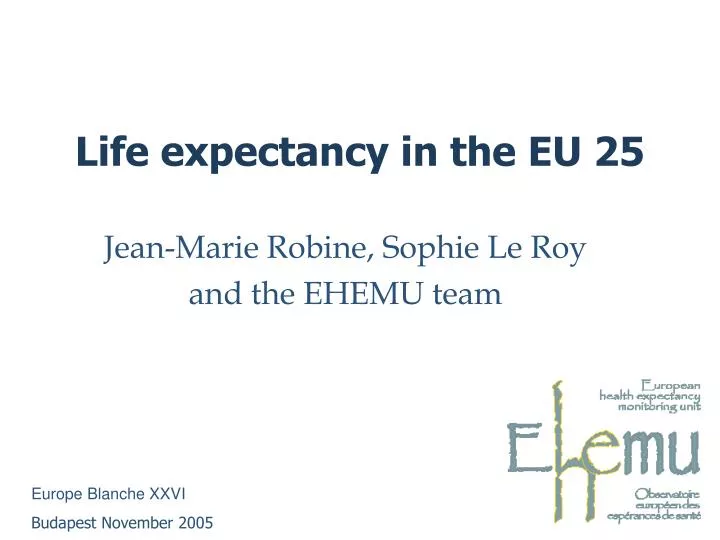
Life expectancy in the EU 25. Jean-Marie Robine, Sophie Le Roy and the EHEMU team. Europe Blanche XXVI Budapest November 2005. EHEMU. To assist the European Commission: to monitor inequalities in health and longevity among the EU countries

E N D
Life expectancy in the EU 25 Jean-Marie Robine, Sophie Le Roy and the EHEMU team Europe Blanche XXVI Budapest November 2005
EHEMU To assist the European Commission: • to monitor inequalities in health and longevity among the EU countries • to explore compression or expansion of healthy life through cross-national comparisons of healthy life expectancy at birth and age 65 • to explore gender differences in health, longevity and healthy life expectancy • with analysis of the new EU structural indicator Healthy Life Years
More on EHEMU • EHEMU reports • General reports on life and healthy life expectancies in the European Union • Country reports • EHEMU database on LE and HE • EHEMU collaborator networks • The public health actor network • The expert network • EHEMU website (http://www.hs.le.ac.uk/reves.ehemutest /index.html)
Life expectancy in the EU 25 Data sources HMD, for the long chronological series (www.mortality.org) Eurostat for the 25 EU countries since 1995 (http://epp.eurostat.cec.eu.int)
Life expectancies at birth in European countries since 1825 and deviations from the maximum values, females
Life expectancies at birth in European countries since 1825 and deviations from the maximum values, males
Life expectancies at age 65 in European countries since 1825 and deviations from the maximum values, females
Life expectancies at age 65 in European countries since 1825 and deviations from the maximum values, males
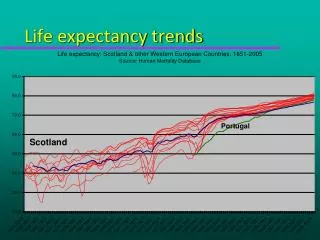
LE at birthin European countriessince 1945and deviations from maximum values,females:high convergence, low convergence, divergent group
LE at birthin European countriessince 1945and deviations from maximum values,males:high convergence, low convergence, divergent group
LE at age 65 in European countries since 1945 and deviations from the maximum values, females: divergent group
LE at age 65 in European countries since 1945 and deviations from the maximum values, males: divergent group
LE at birthin the EUsince 1995and deviations from maximum values,females:Northern Europe, Central Europe, Southern Europe
LE at birthin the EUsince 1995and deviations from maximum values,males:Northern Europe, Central Europe, Southern Europe
Conclusions for LE • The deviations in life expectancy are considerable within the European Union: - reaching a maximum of 12 years for men at birth - reaching a maximum of 7 years for women at birth - at birth as well as at age 65 • The current trends do not suggest that life expectancies are converging • Monitoring changes in life expectancy is crucial for the EU