Download
1 / 35
350 likes | 452 Views
Model-Data Fusion Approaches for Exposure Estimation. Charles Stanier Assistant Professor University of Iowa. CENTER FOR GLOBAL AND REGIONAL ENVIRONMENTAL RESEARCH. Gregory Carmichael, Chemical and Biochemical Engineering Sinan Sousan, Chemical and Biochemical Engineering

E N D
Model-Data Fusion Approaches for Exposure Estimation Charles Stanier Assistant Professor University of Iowa CENTER FOR GLOBAL AND REGIONAL ENVIRONMENTAL RESEARCH
Gregory Carmichael, Chemical and Biochemical Engineering Sinan Sousan, Chemical and Biochemical Engineering Naresh Kumar, Geography R. William Field, Epidemiology Jacob Oleson, Biostatistics Jaemeen Baek, Center for Global and Regional Environmental Research Scott Spak, Center for Global and Regional Environmental Research Sang Rin Lee, Center for Global and Regional Environmental Research Daniel Krewski & Michelle Turner, University of Ottawa, R. Samuel McLaughlin Centre for Population Health Risk Assessment Adam Beranek Collins, Chemical and Biochemical Engineering This research has been supported by a grant from the U.S. Environmental Protection Agency's Science (USEPA) to Achieve Results (STAR) program grant R833865. CMAS Conference
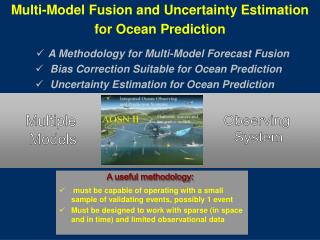
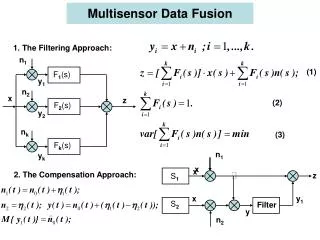
With respect to statistical methods for infusing air quality data and models into health studies • Data fusion (AQS / MODIS / CMAQ) • We want the spatial resolution of the model (4-12 km) • Without the inaccuracies of the model • Simple approach - use computational efficient weighted averaging techniques • Optimal Interpolation • Model evaluation using statistical metrics to select model parameters/settings CMAS Conference
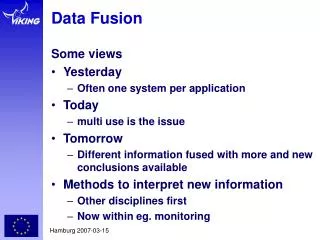
MODIS aerosol optical depth data Emissions Data assimilation 3D Air Quality Model Meteorology Ground Observation Data Chemical Mass Balance Model Spatial-Temporal Analysis Health Data - Census Tracts
I – Traditional Source-Resolved Exposure Estimation Techniques Source-Oriented Modeling Source-Receptor Analysis
I – Traditional Source-Resolved Exposure Estimation Techniques Source-Oriented Modeling Source-Receptor Analysis II – Model-Measurement Hybrid (Data Assimilation)
I – Traditional Source-Resolved Exposure Estimation Techniques Source-Oriented Modeling Source-Receptor Analysis II – Model-Measurement Hybrid (Data Assimilation)
When we assimilate, we try to think in terms of the underlying processes Emissions Regional Transport Boundary Layer Height Boundary Condition Chemical Processes… This can help select strategies for temporal and spatial binning, whether we want the nudging to be short-lived or persistant, etc.
PM2.5 performance evaluation North East Mean Fractional Error (FE) South Central Mean Fractional Error (FE) Mean Fractional Bias (FB) Mean Fractional Bias (FB) 11 • Compared to STN sites: Average to excellent performance.
12 IMPROVE STN 10km MODIS OI Posterior PM2.5 Evaluation CMAQ Temporal Averaging Settings MODIS OPTIMAL INTERPOLATION WORK
OI results for May: Case a: Average and correct all hours Case b: Average overpass hours and correct all hours 13 MODIS AOD CMAQ AOD (Case a) AOD 0.07 AOD 0.22 Posterior CMAQ-derived AOD CMAQ-derived AOD logarithmic scaling factors 16 4 1 0.3
OI Result for May 2002Case: 2a, lmxlmy: 1 (Average and correct all hours) 14 Posterior CMAQ PM2.5 MFB (North East) IMPROVE: -31% to -21% STN : -24% to 21% MFB (Mountain) IMPROVE: -86% to 67% STN : -41% to 95% MFB (Midwest) IMPROVE: -49% to 17% STN : -12% to 24% MFB (Pacific) IMPROVE: -19% to 85% STN : -4% to 91% MFB (South Central) IMPROVE: -76% to 1% STN : -59% to 9% MFB (South Atlantic) IMPROVE: -56% to -7% STN : -38% to 6%
3-D Modeling Settings 7700 met stations 36km resolution domain • 12km resolution domain • Seattle • Los Angeles and Phoenix • Northeastern US 4km resolution domain over Chicago WRF evaluation sections Weather Research and Forecasting (WRF) model 3.1.1 SMOKE 2.5 CMAQ 4.7 with aero 5 and CB05 mechanism Preliminary results shown in WRF-CMAQ comparison is based on MM5 – CMAQ 4.6 modeling
WRF settings [1] • North American Regional Reanalysis (NARR) data is used for initial and boundary data • NARR data is a high resolution (every 3 hour data with a 32km resolution) reanalysis including assimilated precipitation • 3 days spin up time and 15 days run • Objective analysis of bindary and initial data (OBSGRID) • Grid nudging with NARR data • Analysis nudging for 36 and 12km domains • Interval: every three hours • Nudging on over the planetary boundary layer
WRF settings [2] • Microphysics, radiative transfer , land surface model • Morrison double-moment scheme for microphysics • RRTMG scheme for longwave and shortwave physics • Pleim-Xiu land surface model with two soil layers • ACM2 (Asymmetric convective model) PBL scheme • Kain-Fritsch scheme • Observation nudging with Automated Data Processing (ADP) surface and upper air measurements • Observation data was screened using OBSGRID • 12km and 4km • Interval: every hour • Radius of influence: 50km for 12 and 4km resolution
Other studies Gilliam et al (2010) • MM5 settings (Baker, 2004) • Explicit moisture : Reisner I mixed phase - Cumulus: Kain-Fritsch 2 - PBL: Pleim-Chang (ACM) • Radiation: RRTM • Multi-layer soil model: Pleim-Xu - No shallow convection - Analysis nudging on above PBL (4-D Data assimilation0 - No moist physics table
WRF evaluation – statistical benchmarks Emery et al. 2001
WRF – extended statistical benchmarks Distribution of evaluation statistics is simplified as histograms to understand overall trends better
WRF evaluation – Northeastern US with a 12km resolution (Feb. 2002) All sections are in the 2nd bin except the section 20 and 28, which are costal regions
Comparing WRF (currently MM5) statistics and CMAQ mean fractional error Emissions BCs? WG-CB WB-CB S8 Needed for Quantification of skill for health study To guide assimilation strategy To identify model weaknesses S13 S22 S20 S28 S15 S9 WG-CG WB-CG Compensating for transport, removal, ventilation?
MM5 vs. CMAQ performances [1](STN Sites. Jan. 2002) S8 S22 S8 S5 S8 S22 S13 S15 S24 S4,18 S20 S8 S11 S20 S28 S3, 9,10 S28 S8 S8 S22 S5 S22 S24 S13 S28 S13 S6 S6 S15 S3
Conclusions & Recommendations • Use statistical approaches (with benchmarks) to evaluate model-measurement skill • Divide into geographical regional • Consider different timescales (sensitive to different types of errors) • Consider stratification of data into clean, moderate and polluted periods • Often require specific analysis by season and for urban and rural areas • OI of MODIS can work, but there are issues to be worked out • Current nationwide 2002 WRF run has most trouble in Mountain West and in northern New England CTM error Met error (RH / T / WS / WD )
PM2.5 performance evaluation 26 % Excellent - Good Average • Compared to IMPROVE sites the model show less PM2.5 estimate correlation than STN sites. • Major PM2.5 species that contribute to model biases are OC, sulfate, and nitrate. • PM2.5 bias is due to OC and nitrate. Problematic For both IMPROVE and STN networks in 2002 (Independent of location) 1BOYLAN, et al., 2006a. PM and light extinction model performance metrics, goals, and criteria for three-dimensional air quality models. Atmospheric Environment 40, 4946-4959.
WRF evaluation – Northeastern US with a 12km resolution (Jun. 2002) Performance of wind direction simulation in section 20 and 28 is better than that in February.
Techniques are Aimed at Helping to Solve the Component Toxicity Problem October 12, 2010 CMAS Conference 32
Exposure estimates are means across metropolitan statistical areas Krewski et al. (2009) Extended followup ACS Lall et al. (2004) Atmos. Environ. Smith, Jerrett et al. Lancet (2009)