Download
1 / 21
210 likes | 215 Views
This study aims to estimate contaminant loads at Mallard Island by using sediment data and concentrations to calculate long-term averages since 1995. Recommendations for improving TMDLs will be made based on the findings.

E N D
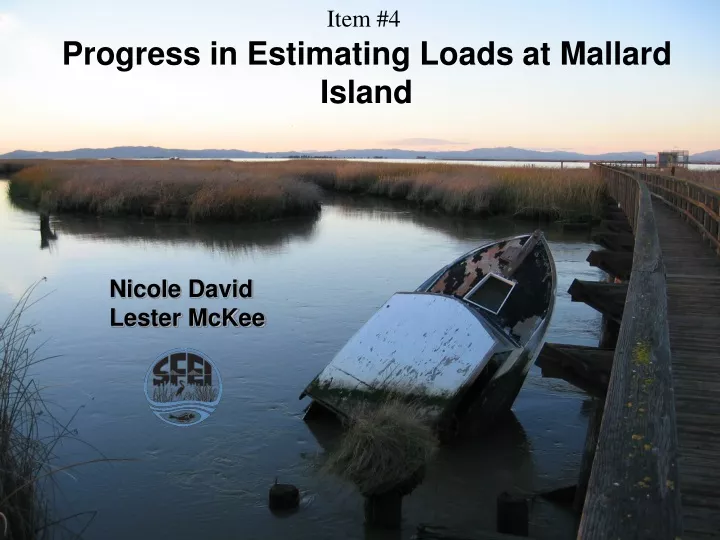
Item #4 Progress in Estimating Loads at Mallard Island Nicole David Lester McKee
Item #4 Objective • Obtain contaminant data collected at Mallard Island • Use concentrations in combination with sediment data to estimate loads • Calculate long-term averages beginning with WY 1995 • Make recommendations to improve TMDLs
Methods • Use SSC data from USGS from 1995 to present • 2. Use instantaneous SSC and contaminant data • to develop a regression relationship (WY 2002-2006) • Estimate 15 minute contaminant concentrations • 4. Calculate daily average concentrations • Use linear interpolation to fill data gaps • 6. Combine estimated daily concentrations with • Delta Outflow to estimate daily advective loads • Correct loads for the effect of tidal influence • and dispersion Item #4
Item #4 Step by StepSSC • Turbidity measurements taken at MI in 15 minute intervals with optical sensor (USGS) • Data processing system utilized to erase unusual high voltage outputs of short duration • Data converted to SSC concentrations using linear regression equation and calibrated with instantaneous samples
Item #4 SSC data for the Period of Record
Item #4 Step by StepDAYFLOW • Discharge calculated continuously by DWR • Input data for discharge include the principal Delta stream inflows, Delta precipitation, Delta exports, and Delta gross channel depletions • DAYFLOW (computer program for determining Delta hydrology) accounts for advective flux only
Item #4 Dayflow for the Study Period
Item #4 Step by StepLoad Analysis • Scatter plot for contaminant and SSC relationship including all data collected
Item #4 Step by StepLoad Analysis • 15 minute contaminant concentrations estimated using regression line • DAYFLOW combined with daily SSC to estimate daily advective loads • Tidally driven advective and dispersive fluxes estimated with velocity and SSC data (USGS) • Freshwater advective loads adjusted with estimates for tidally driven fluxes • Errors associated with calculation and an additional error for lab analysis are estimated
Item #4 Step by StepLoad Analysis =0.11*SSC+2.98 Dayflow*3600*24*1000*HgT dayAv/1,000,000,000,000 Dispersive=-Advective*Dispersive Flux Ratio Advective+Dispersive=Total
Item #4 Samples Collected * Preliminary data
SSC – Hg Relationship y = 0.22x + 4.31 R2=0.66 y = 0.11x + 2.98 R2=0.74
Item #4 Low Flow Data
Item #4 Results • Revised annual mercury load for Delta • Particles leaving Delta during high flows are more contaminated • New load estimates for mercury about 33% higher than previously predicted
Item #4 Loads from the Delta DO NOT QUOTE! * Preliminary data, still missing September
Item #4 Unique contaminant dataset from Delta gained through January 2006 flood
Item #4 370,000 cfs Delta Outflow from 12/20/05 to 01/25/06
Item #4 THANK YOU