Download

1 / 13
130 likes | 264 Views
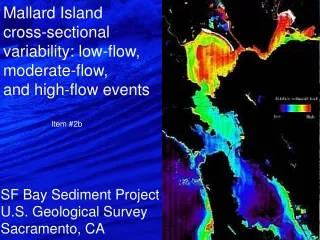
Mallard Island cross-sectional variability: low-flow, moderate-flow, and high-flow events. Item #2b. SF Bay Sediment Project U.S. Geological Survey Sacramento, CA. Mallard Island Cross-sectional Variability. Item #2b. Validation of sediment load calculation methodology

E N D
Mallard Island cross-sectionalvariability: low-flow, moderate-flow, and high-flow events Item #2b SF Bay Sediment ProjectU.S. Geological SurveySacramento, CA
Mallard Island Cross-sectional Variability Item #2b • Validation of sediment load calculation methodology • by McKee et al. (2005) • Low-flow measurement on August 31, 2004 • Freshwater outflow at a minimum (~ 113 cms = 4,000 cfs) • Peak spring tide • Large wind-waves (>1 m) • Moderate-flow measurement on January 4, 2005 • Freshwater outflow moderate (~ 1830 cms = 64,000 cfs) • 2 days after neap tide • No wind-waves • High-flow measurement on January 5, 2006 • Freshwater outflow highest since 1997 (~ 9700 cms = 340,000 cfs) • 3 days after peak spring tide • No wind-waves
Item #2b Protocol • ADCP: Perform discharge measurement, identify five discharge centroids • CTDO profiling: After ADCP measurement, return to five centroids, lower and raise CTDO package through water column at each centroid • Water sampling: Periodically collect water samples for optical sensor calibration, at multiple depths • Compare discharge-weighted SSC with SSC at gagehouse (used for McKee calculation)
Suspended-sediment record at Mallard Island Low-flow, spring tide sampling: 8/31/2004, Q = 3,892 cfs Item #2b
Suspended-sediment record at Mallard Island Moderate-flow, first-flush sampling: 1/4/05, Q = 64,000 cfs Item #2b
Suspended-sediment record at Mallard Island High-flow, first-flush sampling: 1/5/06, Q = 340,000 cfs Item #2b
Comparison of cross-sectional, velocity-weighted SSC and Mallard Island upper SSC Item #2b Bias due to high SSC on north side of channel
Item #2b Reasons to reserve judgment: NASA Pulse at Mallard Island Satellite image taken over SF Bay
Item #2b Reasons to reserve judgment: NASA • NASA-ASTER image March 3, 2000, Q=150,000 cfs • Centroid of sediment pulse seaward of Suisun Bay • 17 days after peak Dayflow, 12 days after peak SSC at Mallard Island • Sediment storage in Honker Bay affecting SSC in Mallard Island X-S
Item #2b Reasons to reserve judgment: models Modeled cross-sectional SSC vs. modeled upper sensor SSC
Item #2b Reasons to reserve judgment: models Daily averages: modeled cross-sectional SSC vs. modeled upper sensor SSC Mean error = 25% McKee (2005) estimate = 30%
Item #2b Next steps • Not enough information to definitively modify McKee’s flux estimates • Are extremes bracketed? I think so… • Need quasi-continuous velocity and SSC data over the duration of a multi-day flood event, across the channel • Two possible approaches • - Deploy multiple instrument packages in channel • - Perform a few cross-sectional surveys everyday for the duration of a 3-5 day flood pulse