Download
1 / 9
90 likes | 96 Views
This report provides insights into the average time spent on different media platforms and activities, based on data from 34 markets. It includes information on digital, TV, online activity, and multi-screening habits.

E N D
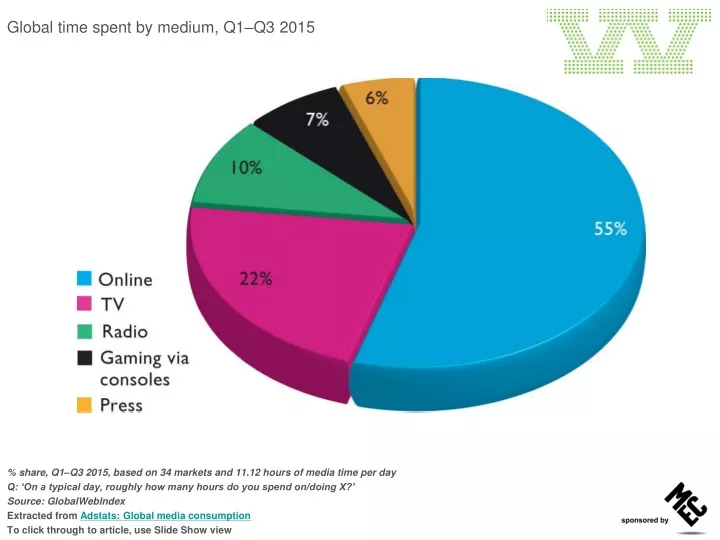
Global time spent by medium, Q1–Q3 2015 • % share, Q1–Q3 2015, based on 34 markets and 11.12 hours of media time per day • Q: ‘On a typical day, roughly how many hours do you spend on/doing X?’ • Source: GlobalWebIndex • Extracted from Adstats: Global media consumption • To click through to article, use Slide Show view
Time spent by medium by key market, Q1–Q3 2015 • No. of hours, Q1–Q3 2015 • Q: ‘On a typical day, how many hours do you spend on/doing X?’ • Note: ‘Online via PC’ includes laptop and tablet; the data includes multiple media consumption via multitasking • Source: GlobalWebIndex • Extracted from Adstats: Global media consumption • To click through to article, use Slide Show view
Digital time spent by medium by key market, Q1–Q3 2015 • No. of hours, online via mobile, PC, laptop or tablet, Q1–Q3 2015 • Q: ‘On a typical day, roughly how many hours do you spend on/doing X?’ • Note: The data includes multiple media consumption via multitasking • Source: GlobalWebIndex • Extracted from Adstats: Global media consumption • To click through to article, use Slide Show view
Global digital time spent by medium, Q1–Q3 2015 • % share, Q1–Q3 2015, based on 34 markets and 6.09 hours online via mobile, PC, laptop or tablet per day • Q: ‘On a typical day, roughly how many hours do you spend on/doing X?’ • Source: GlobalWebIndex • Extracted from Adstats: Global media consumption • To click through to article, use Slide Show view
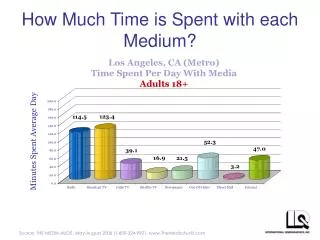
Time spent by medium by age, Q1–Q3 2015 • No. of hours, Q1–Q3 2015, based on 34 markets. • Q: ‘On a typical day, roughly how many hours do you spend on/doing X?’ • Source: GlobalWebIndex • Extracted from Adstats: Global media consumption • To click through to article, use Slide Show view
TV vs. online TV, Q1–Q3 2015 • No. of hours, Q1–Q3 2015, based on 34 markets. • Q: ‘On a typical day, roughly how many hours do you spend on/doing X?’ • Source: GlobalWebIndex • Extracted from Adstats: Global media consumption • To click through to article, use Slide Show view
Multi-screening while watching TV, 2012-2015 • % of respondents, averages across all waves conducted in each year. Based on 34 markets • Q. Which of the following devices have you used while watching TV? • Source: GlobalWebIndex • Extracted from Adstats: Global media consumption • To click through to article, use Slide Show view
Online activity while watching TV, Q1–Q3 2015 • % of respondents aged 16–64, Q1–Q3 2015. Based on 34 markets • Q: ‘The last time you were watching TV and using the internet, which of the following were you doing?’ • Source: GlobalWebIndex • Extracted from Adstats: Global media consumption • To click through to article, use Slide Show view
Additional data sources for the Nielsen Global AdView Pulse report include: admanGo, Arce Media, IBOPE, Media Services, Mediamonitor, Nihon Daily Tsushinsha and PARC. Figures are estimated net with Nielsen Global AdView estimated weighting factors, except for Australia, Ireland and the UK, which are estimated net at source.