Download
1 / 38
380 likes | 403 Views
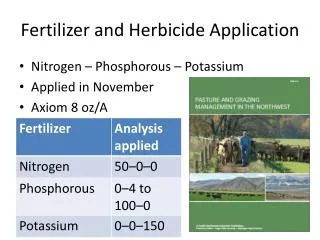
Precision Management beyond Fertilizer Application Hailin Zhang. Outline. Animal manure management Feed, forage and pasture Carbon sequestration and credits. Whole Farm Nutrient Planning. Select a Field to Apply Manure. Soil Test Phosphorus. 5. 6. x. x. /. /. /. /. 123. 1. 4. 3.

E N D
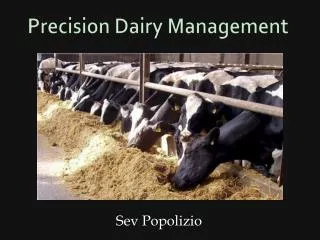
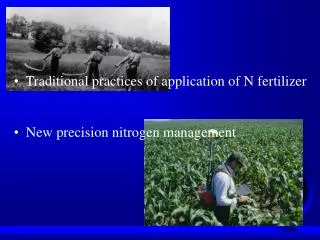
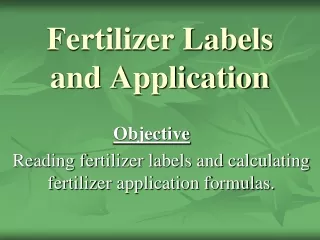
Precision Management beyond Fertilizer ApplicationHailin Zhang
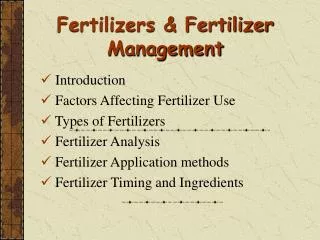
Outline • Animal manure management • Feed, forage and pasture • Carbon sequestration and credits
Select a Field to Apply Manure Soil Test Phosphorus 5 6 x x / / / / 123 1 4 3 / / / / x 7 / 30 2 / 57 100 x 177 x x x x STP STP 0-65 250 - 400 65-120 400+ or no application 120-250
Managed Outputs Meat & Milk Crops Manure Farm Boundary Nutrient Balance Nutrient Balance Inputs Feed Animals Irrigation Water Fertilizer Legume N Losses or Soil Storage
Requires More Treatment for Drinking Water Supply • Decreases Recreational Value • Declined Aesthetic Quality EutrophicationImpacts: 0.02ppm D. Storm
Critical Source Area P Source Transport Critical source areas for P loss from a watershed occur where areas of high soil P and transport potential coincide---Sharpley, et al., 1999
Assessing Site Vulnerability to P Loss High soil P, no runoff High soil P and runoff Surface runoff, low soil P Saturated areas where surface runoff can occur 34-13
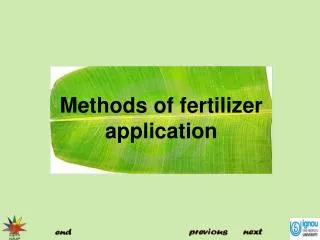
Management Strategies • Manipulation of Animal Diets • Adjust the amount of P supplement • Increase P availability in feed • Manure Management • Base application rates on P needs • Explore alternative uses • Soil P Management • Minimize P transport • Remove P with crop
USDA-NRCS P Management Strategies • Soil test P for agronomic use: P requirements of the crop • P threshold approach: establish critical soil test P levels • P risk index approach: integrates P source and transport characteristics of a field
What is a P Loss Index • The Phosphorus Loss Index is a field based planning tool that integrates soil properties, hydrology and agricultural management practices to assess the risk of P movement from soil to water
Decisions based on Agronomic Soil Test P alone may inadequately address P related environmental problems. A more comprehensive approach is needed for evaluating specific soils, landscapes, and management system for potential loss of P to water bodies.
The P Index consists two 4 by 5 matrix. The following are examples of those matrix recommended by the National P Working Group. Some states chose to use different weighing factors or add more components to them.
Interpretation of the P Loss Index Manure application rate is limited by PI, BMPs may be required if PI is high
Factors Considered for P Risk Index under development in Oklahoma • Source factors • Soil test P level, manure, fertilizers • Rate and method of P application • Transport factors • Monthly runoff volume, delivery ratio, P enrichment ratio • BMPs • Distance to water bodies, cattle exclusion, alternative watering sources • Buffer strips, riparian establishment and restoration • Soil and/or amendments • Receiving water body sensitivity? • TMDL or state water quality standard
Apply at Agronomic rate based on Crop N requirement • Agronomic benefits from N and P Level 1: Field-scale P Risk Index (PRI) No Soil Test P > 120? Yes Go To Level 2 Management Based on PRI
How does spatial variability influence soil test P and crop response?
Level 2: Field-scale Background P Loss Without P Additions Yes Additional BMPs Available? Greater Than Acceptable Loading? No No P Additions Yes No • Soluble P • Field Loading • Annual Rainfall • Surface Runoff • Land Use • Soil Properties • Soil P Status Greater Than Acceptable Loading? Total P Loss in Surface Runoff Adjust Total P Loading Yes • Sediment P Field Loading • Soil Erosion • Soil P Status • Delivery Efficiency BMP Credits No Go To Level 3
N Based Poultry Litter Application Level 3: Field-scale P Loss With P Additions Level 2 Background Total P Loss Adjust Total P Loading Reduce Litter Application Yes Greater Than Acceptable Loading? Greater Than Acceptable Loading? Adjust Total P Loading Acceptable Risk No Yes BMP Credits No
Vegetative Filter Strips • Reduces Surface Runoff • Increases Infiltration of Runoff and Nutrients • Promotes Sediment Deposition and Filtering • Provides Uptake of Nutrients by Plants
Buffer Strip Length (ft) • Total Phosphorus • Soluble Phosphorus Phosphorus Concentration In Runoff (ppm)