Download
1 / 30
300 likes | 304 Views
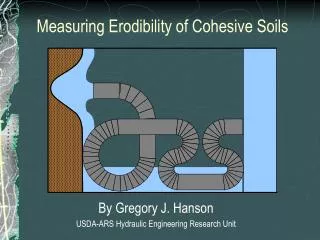
Measurement of Fabric in Cohesive Soils. Direct and Indirect Methods Direct Methods Optical microscope → direct observation of macrostructural features basically. Electron microscope → direct observation of microstructural features and macrostructural features.

E N D
Direct and Indirect Methods Direct Methods • Optical microscope→ direct observation of macrostructural features basically. • Electron microscope → direct observation of microstructural features and macrostructural features. • X-ray diffraction → orientation of clay particles, groups of parallel clay plates produce stronger diffraction than randomly oriented plates. • Pore size distribution
Indirect Methods • Acoustical velocity → particle arrangement influences velocity of sound waves. • Dielectric dispersion and electrical conductivity • Thermal conductivity • Magnetic susceptibility • Mechanical properties • Strength • Modulus • Permeability • Compressibility • Shrinkage-swell.
Determination of Pore size distribution → forced intrusion of nonwetting fluid Nonwetting fluid means “fluid to solid contact angle >90°. Contact angle of mercury on soil is 140°. d= -4ד Cosθ/P (Washburn equation) where: d: diameter of pore intruded ד : surface tension of the intruding fluid θ : contact angle P: applied pressure
The total volume of mercury intruded at each pressure, gives the total volume of pores with an equivalent diameter larger than that corresponding to that pressure. For mercury ד = 4.84x10⁻⁴ N/mm at 25°C θ = 130-140 °
Sample preparation of fabric analysis You have to dry the specimen for fabric studies in general. Drying techniques are: • Air drying • Oven drying • Freeze drying • Critical point drying
Air drying May be suitable for stiff soils, partly saturated soils and others that do not show significant shrinkage. 2. Oven drying Same as air drying. For soft samples at high water content, it is better than air drying.
3. Freeze drying By liquid nitrogen, sudden freezing crystalline ice will not deform below -130 °C. Then sublimation of the frozen water is carried out at temperature betwen -50 and -100 °C.
4.Critical point drying Raise the temperature and pressure of the sample above the critical values. For water 374 °C and 22.5 MPa. In the critical range the liquid and vapour phases are indistinguisable and the pore water may be distilled away without the presence of air water interfaces that lead to shrinkage.
Soil behavior Factors affecting the engineering properties: • Compositional factors • Environmental factors
Compositional factors: • Type of minerals • Amount of each mineral • Type of absorbed cations • Shape and size distribution of particles • Pore water composition They can be studied using disturbed samples.
b. Environmental factors: • Water content • Density • Confining pressure • Temperature • Fabric • Availability of water They are studied using undisturbed samples or by insitu measurements. No quantitative prediction of soil behavior completely in terms of compositional or environmental factors. Qualitative prediction.
To study compositional-property relationships there are 2 procedures which can be followed: • Natural soils are used, the composition and engineering properties are determined. • Synthetic soils of known composition are used and engineering properties are determined.
The Dominating Influence of Clay Phase: In general, as clay content ↑ plasticity ↑ volume change potential ↑ compressibility ↑ permeability ↓ true cohesion ↑ true angle of internal friction ↓.
Different clay minerals has different engineering properties. Within anyone group of clay minerals the range may also be great, because of: • Particle size • Degree of crystallinity • Type of absorbed cations • Type and amount of free electrolyte in the pore water. In general, the importance of these factors increases in the order: Kaolinite →hydrous mica (illite) → Smectite
Particle size and shape Size increases in order: Montmorillonite →Illite → Kaolinite 0.1 µm → 0.1-0.2 µm → 0.2-2.0 µm Shape: for clays commonly platy (halloysite as tube) Kaolinite → relatively large, thick and stiff. Smectite → small, very thin and filmy. Illite → in between. They are terraced and thin at the edges.
Hydraulic conductivity (permeability) Factors influencing coefficient of permeability: • Mineralogical composition • Particle size and its distribution • Void ratio • Fabric (pore size distribution) • Pore fluid characteristics.
Over the normal range of water contents (PL & LL) k< 1x10⁻⁵ cm/sec and may range to values less than 1x10⁻¹⁰ cm/sec for some monovalent smectite minerals. Usual range for natural clay soils: 1x10⁻⁶ _ 1x10⁻⁸ cm/sec. For clay minerals at the same water content k, smectite<illite<kaolinite
Shear strength: ד= c+σtanΦ Quartz> Kaolinite >Illite >Montmorillonite Ranges in a given mineral type are due to: • Adsorbed cation type; • pH, • Fabric • Overconsolidation ratio (OCR) OCR= preconsolidation pressure/present effective stress.
Compressibility Montmorillonite > Illite > Kaolinite Type of minerals Cc Cv (cm2/sec)x10-4 Kaolinite 0.19-0.28 12-90 Illite 0.50-1.10 0.3-2.4 Montmorillonite 1.00-2.60 0.06-0.3
Effect of organic matter As organic matter ↑ plasticity ↑ volume change potential ↑ compressibility ↑ permeability ↓ strength ↓. As organic matter ↑ LL ↑ PL ↑ in such a manner that PI ↑. Effect of organic matter on compaction and strength: As organic matter ↑ ρd(max) ↓O.W.C ↑ Unconfined compressive strength qu ↓.
Activity • Both type and amount of clay in a soil influence the properties and Atterberg limits reflect both of these factors. • Skempton 1953 defined activity to separate these factors. • Activity= PI/% Clay fraction (% smaller than 2 µm)
Minerals Activity Smectite 1.0-7.0 Illite 0.5-1.0 Kaolinite 0.35-0.5 Halloysite (2H2O) 0.5 (Metahalloysite) Halloysite (4H2O) 0.1(hydrated halloysite) Attapulgite 0.5-1.2 Allophane 0.5-1.2 As Activity increases, clay fraction has more influence on the properties.
Seed, Woodward, and Lundgren (1964) Activity= PI/c-n n=5 for natural soils n= 10 for artificial soils
Influence of exchangable cations and pH The influence of cations on properties increases with increasing activity of the clay. Exchangable cations: Size and valence are important influencing double layer thickness. Na-Li montmorillonite → unrestricted interlayer swelling Di or tri-valent montmorillonite → up to 18A° swelling.
Non-expansive clays Monovalent cations (Na, Li) → deflocculation Di-tri-valent cations → flocculation As valency ↓ double layer thickness ↑ stability ↓ pH is the most important in kaolinite from fabric point of view. Repulsion is very sensitive to pH.
Shrinkage and swelling (volume change character) Considering clay mineral structures montmorillonite and vermiculate (in general smectite) have larger volume change potential than kaolinites and hydrous mica (illite). To identify high volume change soils, parameters which are related to clay mineral composition are determined. These are: shrinhage limit plasticity index activity % < 2 µm size.
See, Woodward and Lundgren, 1962 The standard for comparison was the expansion of laterally confined specimens, prepared at optimum water content using standard AASHO compactive effort and allowed to swell under a surcharge of 1 psi. They found an excellent correlation: S= 3.6X10⁻⁵AC3.44 S: Percent swell A= Activity C= Percent clay size (< 2µm)
See, Woodward and Lundgren on natural soils: S= 2.16X10⁻³(PI)2.44 Ranganatan and Satyanarayana, 1965 black cotton soil of India Swell activity = SA= SI/C SI: Shrinkage index SI: LL-SL S= 4.13X10⁻⁵(SI)2.67
Viscoelastic Behavior Time dependent deformations and stress variations as indicated by secondary compression, creep and shear relaxation are very much dependent on compositional factors. In general, organic soils and highly plastic clays show stronger viscoelastic behavior.