Download
1 / 97
970 likes | 1.12k Views
Hurricane Katrina: Impacts on the P/C Insurance & Reinsurance Industries. Midwest Actuarial Forum Bloomington, IL September 22, 2005. Robert P. Hartwig, Ph.D., CPCU, Senior Vice President & Chief Economist Insurance Information Institute 110 William Street New York, NY 10038

E N D
Hurricane Katrina:Impacts on the P/C Insurance & Reinsurance Industries Midwest Actuarial Forum Bloomington, IL September 22, 2005 Robert P. Hartwig, Ph.D., CPCU, Senior Vice President & Chief Economist Insurance Information Institute 110 William Street New York, NY 10038 Tel: (212) 346-5520 Fax: (212) 732-1916 bobh@iii.org www.iii.org
Presentation Outline • P/C Financial Overview: A Position of Strength • Industry Claims-Paying Resources • Underwriting Performance pre-Katrina • Catastrophe Loss Management: • Loss estimate overview • Hurricane Katrina’s place in history • Loss distribution (geographic & by line) • Impact on financial & underwriting performance • Influence of legal environment on Katrina claims • National Flood Insurance Program Overview • Managing Natural CATs in a Post-9/11 World • Q & A
P/C Financial OverviewStrong Pre-Katrina Results Help Industry Meet the Challenge
P/C Net Income After Taxes1991-2005:H1 ($ Millions)* Pre-Katrina profits were strong, helping industry cope with mega-loss • 2001 ROE = -1.2% • 2002 ROE = 2.2% • 2003 ROE = 8.9% • 2004 ROE = 10.5%* • 2004:H1 ROE = 15%E “Record” 2004 profits wrongly cited as reason why insurers should pay excluded flood losses *ROE figures are GAAP; 2004 figure is return on average surplus. 2005 figure is estimate Sources: A.M. Best, ISO, Insurance Information Institute.
ROE: P/C vs. All Industries 1987–2005F* 2005:H1 P/C ROAS = 15% 16.3 Pts. 2005 P/C ROAS = 11% after adjusting for Katrina *GAAP ROEs except 2004/5 P/C figure = return on average surplus. 2005 figure is III full-year estimate. Source: Insurance Information Institute; Fortune for all industry figures
ROE vs. Equity Cost of Capital: US P/C Insurance:1991 – 2005* Because p/c insurers today generally are earning their cost of capital and are financially strong, they should be able to readily access fresh capital if necessary. +5.0 pts +0.6 pts -9.0 pts -1.7 pts -13.2 pts US P/C insurers missed their cost of capital by an average 6.3 points from 1991 to 2003 *First half 2005 estimate. Source: The Geneva Association, Ins. Information Inst.
P/C Insurers Stocks Remain Up, Brokers Up Too, Reinsurers Down Total Return 2005 YTD Through September 16, 2005 P/C insurer stocks outperforming the market despite Katrina Reinsurers down more on Katrina news Source: SNL Securities, Standard & Poor’s, Insurance Information Institute
Change in YTD Stock Performance by Sector Pre- & Post-Katrina P/C & reinsurer stocks hurt by Katrina, broker stocks rose on expectation of tighter conditions and demand for broker services Source: SNL Securities; Insurance Information Institute
U.S. Policyholder Surplus: 1975-2005* Capacity TODAY is $401.8 billion 21% above its mid-1999 peak and 44% above its 2002 trough & will be able to pay Katrina claims. $ Billions PHS backs all lines of insurance in all states. PHS is not fungible and is frequently misunderstood and misused “Surplus” is a measure of underwriting capacity. It is analogous to “Owners Equity” or “Net Worth” in non-insurance organizations Source: A.M. Best, ISO, Insurance Information Institute *As of 3/31/05.
US Reinsurers: Change in Policyholder Surplus ($ Billions) Reinsurer PHS fell 20% from 1998-2002. Capacity today similar to 1998. Same story globally. Source: A.M. Best; Insurance Information Institute
UNDERWRITINGStrong Underwriting Results Pre-Katrina Will Help Industry Weather the Storm
P/C Industry Combined Ratio* 2001 = 115.7 2002 = 107.2 2003 = 100.1 2004 = 98.3 2005:H1 = 93* Combined Ratios 1970s: 100.3 1980s: 109.2 1990s: 107.8 2000-05E: 103.9 The industry has just experienced its most remarkable recovery in recent history. Katrina will partially reverse this Sources: A.M. Best; ISO, III. *2005 figure is III estimate.
Underwriting Gain (Loss)1975-2005E* Before Katrina, p/c insurers were on track for only the second underwriting profit in 26 years $ Billions *2005 estimate is based on annualized actual 05Q1 underwriting profit of $7.1 billion. Source: A.M. Best, Insurance Information Institute
Commercial vs. Personal Lines Combined Ratios, 1993-2005:H1* Compression of results is due to low interest. Underwriting is now more important in long-tail commercial lines. Katrina impact will be severe. HurricaneAndrew Source: A.M. Best; Insurance Information Institute *III estimate for first half 2005.
Homeowners Insurance Combined Ratio Average 1990 to 2004E= 114 Insurers have paid out an average of $1.15 in losses for every dollar earned in premiums over the past 14 years Katrina will devastate the HO combined ratio HurricaneAndrew Sources: A.M. Best; III
Homeowners Insurance:Rates of Return on Net Worth vs. P/C Insurance All Lines Homeowners insurance consistently underperforms the p/c insurance generally 1990-2004E Homeowners: -1.7% All P/C Lines: +7.5% Source: NAIC, Insurance Information Institute * Average is 1.22% if excluding 1992 (year of Hurricanes Andrew and Iniki.
Combined Ratio: Reinsurance vs. P/C Industry • 2001’s combined ratio was the worst-ever for reinsurers; 2002 was bad as well. • 2003: Big improvement in primary and reinsurer segments • 2004/5: CATs hurt reinsurers HurricaneAndrew * First half 2005 III estimate for all lines. RAA figure for 2005:H1 Source: A.M. Best, ISO, Reinsurance Association of America, Insurance Information Institute
UNDERWRITING AFFECTS FINANCIAL STRENGTHIs There Causefor Concern?
Reason for P/C Insolvencies(218 Insolvencies, 1993-2002) Reserve deficiencies account for more than half of all p/c insurers insolvencies Source: A.M. Best, Insurance Information Institute
Historical Ratings Distribution,US P/C Insurers, 2000 vs. 2004 2000 2004 A++/A+ shrinkage Source: A.M. Best: Rating Downgrades Slowed but Outpaced Upgrades for Fourth Consecutive Year, Special Report,November 8, 2004.
US Reinsurer Combined Ratio vs. Median Rating, 1999-2003* A++ A+ A+ A A A A A A- Are ratings related to performance? B++ B+ B *Combined ratio is for all US reinsurers. Rating is for large reinsurers (policyholder surplus exceeding $250 million). The median rating for small reinsurers (PHS<$250M) was A- throughout the 1999-2003 period. Source: A.M. Best: Rating Downgrades Slowed but Outpaced Upgrades for Fourth Consecutive Year, Special Report,November 8, 2004.
P/C Company AIU Insurance Co. Alfa Mutual Ins. Co. Amica Mutual Ins. Co. Church Mutual Ins. Co. Federal Insurance Co. General Reinsurance Corp. Great Northern Ins. Co. Lititz Mutual Ins. Co. Nationwide Mutual Fire Co. Otsego Mutual Fire Pharmacists Mutual Ins. Co. Quincy Mutual Fire Ins. Co. State Automobile Mutual Ins. Co. State Farm Mutual Auto Ins. Co. Vigilant Insurance Co. Group Affiliation American International Group Alfa Insurance Group Amica Mutual Group None Chubb Group of Ins Cos. Berkshire Hathaway Ins. Group Chubb Group of Ins Cos. Lititz Mutual Group Nationwide Mutual Group None None Quincy Mutual Group State Auto Ins. Group State Farm Group Chubb Group of Ins Cos. P/C Insurers Maintaining Rating of A+ or Better Rating for 50+ Years Source: Best’s Review, January 1, 2004.
Strength of Recent Hard Markets by NWP Growth* 1975-78 1984-87 2001-04 Real NWP Growth During Past 3 Hard Markets 1975-78: 8.6% 1984-87: 11.2% 2001-04: 6.9% Premium growth is faltering. Real growth in 2005 will be NEGATIVE Note: Shaded areas denote hard market periods. Source: A.M. Best, Insurance Information Institute *2005 figure is III forecast based on 05Q1 result.
*Insurance Information Institute Estimates/Forecasts Source: NAIC, Insurance Information Institute Average Expenditures on Auto Insurance Countrywide auto insurance expenditures are expected to rise 1.5% in 2005 Will the “big guys” stay disciplined? So far, so good. Will adopt tiering to avoid adverse selection
*Insurance Information Institute Estimates/Forecasts Source: NAIC, Insurance Information Institute Average Expenditures on Homeowners Insurance Countrywide home insurance expenditures are expected to rise 2.5% in 2005
Commercial Premium Rate Changes Are Sharply Lower Is moderation due to realization of performance and profit goals, increasing capacity/ capital, or market- share strategies? Source: MarketScout.com
Average Rate Change, All Lines,(1Q:2004 – 2Q:2005) Magnitude of rate decreases accelerated during the first half of 2005, but flattened out in Q2 Source: Council of Insurance Agents & Brokers; Insurance Information Institute
Rate Changes by Line,2nd Qtr. 2005 Magnitude of rate decreases flattened out during the second quarter of 2005 Source: Council of Insurance Agents & Brokers; Insurance Information Institute
Average Commercial Rate Change by Account Size Commercial accounts have trending downward for 4-5 quarters, with large commercial leading the way. Now starting to flatten.
Cumulative Quarterly Rate Change by Account Size Commercial rates are well off their late 2003 peaks for accounts of all size and are approximately where they were in mid-2002 At which point do the reductions become destructive?
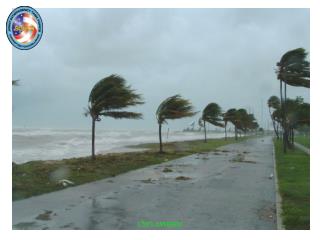
2005 Has Been a Busy, Destructive & Expensive Hurricane Season Source: WeatherUnderground.com, 9/22/05.
Hurricane Katrina Insured Loss Estimates Still Vary Widely Typically unmodeled losses: Demand surge*, LAE, debris removal, tree damage, mold, spoilage, power outage, off-premises power loss, flood, fraud, civil authority, assessments, pollution, litigation RMS estimate predicts $15-$25B in privately insured flood losses, mostly commercial (modeled after the event) *Rising material costs, e.g., plywood rose 38% and framing lumber by 14% through Sept. 16, 2005. Sources: RMS, AIR, Eqecat; Compiled by the Insurance Information Institute.
Breakdown of RMS $40-$60 Billion Loss Estimate *Primarily commercial flood and associated business interruption losses. Sources: RMS; Adapted from Responding to Katrina, Lane Financial LLC, Sept. 16, 2005.
Summary of Facts About Insured Losses Regarding Katrina • As of 9/15/05: • 35 companies announced pre-tax loss estimates • Announced loss total: $11.8B to $13.0B • This works out to about 35% of the mid-range insured loss estimate of $35 billion • $35B loss is 8.7% of US PHS; $60B is 14.9% • Announced Company Loss Estimates: • High: $2.55 billion; Low: $2 million • Upper loss est. % of 2Q:05 Equity: 0.2% to 46.1% • At least 20 companies put on watch for possible downgrades by various ratings agencies • Many Lines Affected: • Extreme eventsloss correlations increase
Distribution of Announced Hurricane Katrina Losses ($ Millions)* As of September 15, 35 companies had announced pre-tax losses totaling between $10.7 and $11.9 billion, about 32% of a mid-range industry loss estimate of $35 billion *If company gave range estimate, upper end is used. **After-tax figure. $900 million after reinsurance recoverables. Sources: Morgan Stanley, Company Reports
Announced Hurricane Katrina Losses as % 2Q:05 Equity* Reported losses as a share of US P/C insurance industry surplus ranged from 0.2% to 46.1%. Median = 5.1% NA NA NA Sources: Morgan Stanley, Company Reports *If company gave range estimate, upper end is used.
Insured Loss Estimates as a % US Policyholder Surplus* *Policyholder surplus as of 3/31/05 of $401.8 billion (ISO). Source: Insurance Information Institute.
Top 10 Most Costly Hurricanes in US History, (Insured Losses, $2004) Five of the 10 most expensive hurricanes in US history occurred in the past 13 months: Katrina, Charley, Ivan, Frances & Jeanne *Estimate as of September 9, 2005 in 2005 dollars. Sources: ISO/PCS; Insurance Information Institute.
Top 10 Insured PropertyLosses in US ($2004) Six of the 10 most expensive disasters is US history occurred within the past 4 years *Estimate, stated in 2005 dollars. Note: 9/11 loss figure is for property claims only. Sources: ISO/PCS; Insurance Information Institute.
Top 11 Insured Property Losses Worldwide, 1970-2005 ($2004)* Five of the 11 most expensive disasters is world history affected the US within the past 4 years. *All figures are for total losses across all locations, not just US. Katrina loss est. is preliminary and stated in 2005 dollars. Sources: ISO/PCS; Swiss Re, “Natural Catastrophes and Man-Made Disasters in 2003,” Sigma, no.1, 2004
Government Aid After Major Disasters (Billions)* Within 10 days of Katrina’s LA landfall, the federal government had authorized more aid than for the 9/11 terrorist attacks, the 4 hurricanes that hit FL in 2004, Hurricane Andrew and the Northridge Earthquake combined! Hurricane Katrina aid will dwarf aid following all other disasters. Congress may authorize $150-$200 billion ultimately (about $400,000 for each of the 500,000 displaced families). Is the incentive to buy insurance and insure to value diminished? *In 2005 dollars. **Actual Congressional authorizations approved as of 9/21/05. Includes $6.1B in special tax breaks. Source: Economy.com, White House; Insurance Information Institute.
Hurricane Katrina Loss Distribution by Line ($ Billions)* Total insured losses could be as high as $35 billion *As of September 9, 2005 Source: Merrill-Lynch
Number of Homes Destroyedby Major Hurricanes* Katrina appears to have destroyed 10 times as many homes as Andrew in 1992 or the 4 storms to hit Florida and the Southeast in 2004 *Destruction is defined as a structure made uninhabitable or damaged beyond economic repair. Source: National Association of Home Builders, National Red Cross (as of 9/15/05).
Personal Property Losses Accounted for Largest Share Damage from2004 Hurricanes* Ivan Charley TOTAL Jeanne Frances *Breakdowns based on FL losses, which accounted for 85% of losses for all affected states. Source: ISO/PCS; Insurance Information Institute.
Hurricane Katrina Loss Distribution by State ($ Billions)* Louisiana accounted for 70% of the insured losses *As of September 9, 2005 Source: Merrill-Lynch