Download
1 / 17
450 likes | 1.3k Views
Introduction to SPSS. Descriptive Statistics. Introduction to SPSS. Statistics Program for the Social Sciences (SPSS) Commonly used statistical software package Very user-friendly How you will be doing statistics in graduate school. Introduction to SPSS.

E N D
Introduction to SPSS Descriptive Statistics
Introduction to SPSS • Statistics Program for the Social Sciences (SPSS) • Commonly used statistical software package • Very user-friendly • How you will be doing statistics in graduate school
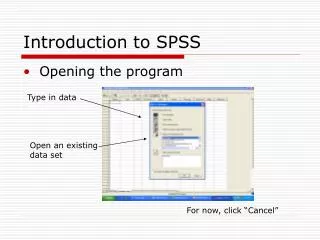
Introduction to SPSS • Divided into “data view” & “variable view” • Default is data view • Data view – shows the data • Variable view – summary of variables, options related to them • Switch between them by: • clicking on tabs located on bottom left of screen • clicking on “View” “Data/Variables” in top menu • pressing CTRL+T
Entering Data • Can either enter data by hand or import from other programs (i.e. Excel) • Hand entering • Insert a variable by: • Right clicking one of the rows in variable view and selecting “Insert Variable” • Entering a “Name” in variable view and pressing “Enter” or “Tab” • Right clicking on a column in the data view and selecting “Insert Variable” • Clicking on the “Insert Variable” icon in the Toolbar • Clicking on “Data” “Insert Variable”
Entering Data • Define variables in variable view • Name = Name of variable displayed in data view • Type = Numeric, Comma, Dot, Scientific notation, Date, Dollar, Custom currency, & String • Width = # of digits displayed in data view • Decimals = # of decimal places displayed in data view • Label = Name of variable displayed when running analyses • Values = Value Labels – i.e. 1 = Male, 0 = Female • Missing = Values that the system will recognize as missing • Columns = # of columns used to display variable in data view • Align = variable left, right, or center aligned • Measure = scale on which variable is measured – Nominal, Ordinal, or Scale (Interval or Ratio)
Entering Data • Importing Data • Click “File” “Open” “Data” • Select the file type in question • If Excel: • Make sure top row of excel file lists variable names & the variables all have different names • After selecting the file, click Enter – make sure the box “Read variable names from the first row of data” is clicked • Make sure you variable are defined properly in the variable view
Menus • File & Edit Menus • Exactly the same as all Windows programs • View Menu • Allows you to customize the SPSS desktop • Status Bar – “Processor Area” at the very bottom of the screen • Toolbars • Fonts • Grid Lines • Value Labels – Make sure this is selected if you want to use them • Variables/Data view
Menus • Data Menu • Define Dates… = Inserts a Date variable • Insert Variable • Insert Case • Go to Case… • Sort Cases… = Ascending or descending order • Transpose… = Switches cases and variables (former in columns and latter in rows) • Merge Files – More on this later • Split Files – More on this later • Select Cases = If condition is satisfied, Random sample of cases, Based on time or case range, Use filter variable
Splitting and Merging Files • Splitting • Click on “Organize output by groups” – grouping variable should be discrete (i.e. gender, hair color, etc.) • Click on grouping variable and move to “Groups Based on” box • Click “OK” • Merging • You can add either variables or cases • If adding variables: • Make sure both files share at least one variable that is identical, the key variable (i.e. SubID) • Make sure both files are sorted by this variable • Make sure, in both files, all cases have data for this variable and there are no duplicate cases • Click on “Merge Files” “Add Variables” • Find the file you wish to merge with the one you have open • The variable in the “Excluded Variables” box should be the key variable, denoted by a (+) indicating its presence in both files • Click on “Match cases on key variables in sorted files” • Move the key variable to the “Key Variables” box • Click “OK”
Menus • Transform Menu • Compute... • Name new variable in “Target Variable” box • Type equation in “Numeric Expression” box • Recode – Into Same/Different Variable • Select variable(s) to recode and move to the “Variables” box • Click “Old and New Values” • Click “OK” • Count… • Name new variable in “Target Variable” box • Select variable(s) with values to be counted & move to the “Numeric Variables” box • Click “Define Values…” • Click “OK” • Rank Cases… • Select variable(s) to rank and move to the “Variable(s)” box • Click “Assign Rank 1 to” either “Smallest value” or “Largest value” • Click “OK”
Obtaining Descriptive Statistics • Click on “Analyze” “Descriptive Statistics” • Frequencies • Use to determine counts on values of variables • Cut scores and %iles
Descriptives • Click on “Analyze” “Descriptive Statistics” • Descriptives • Use to get descriptive statistics (central tendency, variability, etc.) • Use to convert variables to z-scores
Explore • Click on “Analyze” “Descriptive Statistics” • Explore • Use to examine descriptive statistics by grouping variable