Download
1 / 12
140 likes | 443 Views
Introduction to SPSS. Outline. Overview of SPSS Interface Getting Started Managing Data Descriptive Statistics Basic Analysis Additional Resources. NYU Data Services. Tutorials and support for academic software One-on-one consultation by appointment Data Services website:

E N D
Outline • Overview of SPSS • Interface • Getting Started • Managing Data • Descriptive Statistics • Basic Analysis • Additional Resources
NYU Data Services • Tutorials and support for academic software • One-on-one consultation by appointment • Data Services website: • http://nyu.libguides.com/dataservices • Google “nyu data services” • Training tab • Slides and sample code • External resources
Overview of SPSS • SPSS is a statistical package that allows advanced data analysis, management, and graphics. • SPSS has capabilities similar to Stata, SAS, Minitab • There are SPSS student licenses available at NYU computer store for Windows and Mac. • You can also access it through VCL (vcl.nyu.edu) or using NYU computers
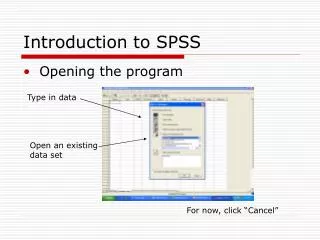
Getting Started: SPSS Files • Data file (.sav) • Syntax File (.sps) • Commands should be written and saved in syntax rather then using SPSS drop down menu: • Some advantages to using syntax files: • allows reusing commands (the same analysis can be quickly repeated on different data sets as long as the variables name match) • allows to copy, past and edit commands • easier to read complex expressions • allows sharing commands / methods with other researchers
Getting Started: SPSS Files • Output (.spv) • Allowssaving both the outcomes of our analysis but can also help retrieve information for further use in a syntax window. • A bit messy – if we are running the same analysis but for example excluding some cases/ outliers it might be a little difficult to keep track of what is what.
Managing Data • Recoding Variables: Can be necessary in several cases: • reverse coded items • continuous variables into grouping variables • grouping variables in OLS • Computing Variables
Descriptive Statistics • For variable’s description: Analyze -> Descriptive Statistics -> Descriptives • For frequencies: Analyze -> Descriptive Statistics -> Frequencies • To detect outliers: Analyze -> Descriptive Statistics -> Explore
Graphs • Scatter Plot: Graphs -> Legacy Dialogs-> Scatter/dot • Histograms: Graphs -> Legacy Dialogs-> Histograms • OR Analyze -> Legacy Dialog
Basic Analysis • Some examples: Correlation Analyze -> Correlate -> BivariateT-tests Analyze -> Compare Means -> Regression Analyze -> Regression-> Linear ANOVA Analyze -> General Linear Models
Additional Help • The Data Services staff is available to answer SPSS related questions. • Email: data.services@nyu.edu • Phone: (212)-998-3434 • Location: 5th Floor of Bobst Library • Please refer to the Data Services training page
Tutorial Evaluation • Please follow the link below: • This will only take a few minutes and help us a great lot in improving the tutorial bit.ly/IntroSPSS