Download
1 / 14
140 likes | 148 Views
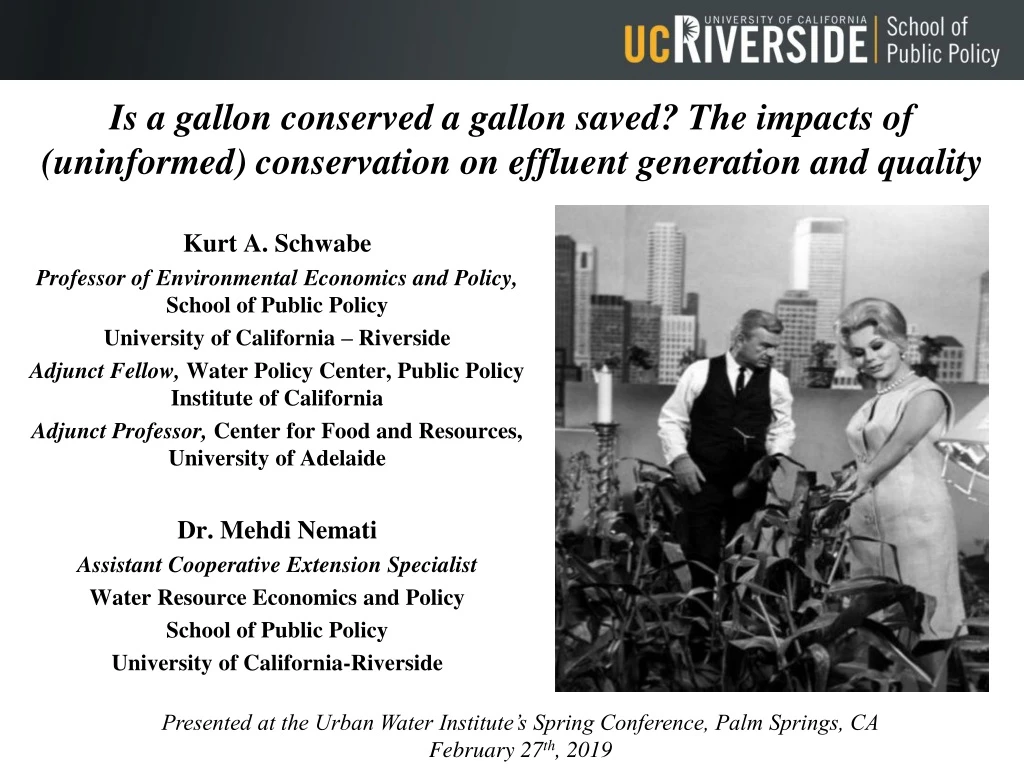
Is a gallon conserved a gallon saved? The impacts of (uninformed) conservation on effluent g eneration and quality. Kurt A. Schwabe Professor of Environmental Economics and Policy, School of Public Policy University of California – Riverside

E N D
Is a gallon conserved a gallon saved? The impacts of (uninformed) conservation on effluent generation and quality Kurt A. Schwabe Professor of Environmental Economics and Policy, School of Public Policy University of California – Riverside Adjunct Fellow, Water Policy Center, Public Policy Institute of California Adjunct Professor, Center for Food and Resources, University of Adelaide Dr. Mehdi Nemati Assistant Cooperative Extension Specialist Water Resource Economics and Policy School of Public Policy University of California-Riverside Presented at the Urban Water Institute’s Spring Conference, Palm Springs, CA February 27th, 2019
California’s Engaged Heavily in Conservation, Efficiency, & Reuse Investments, Legislation, and Policies BC WaterNews 2/24/19 PPIC (2018) • Examples: State Policies • SB606 / AB1668 (legislative actions) • Conservation Mandate (executive action)
Reducing Demand (per capita):Effects of Water Use Efficiency / Conservation (PPIC 2017) • 1995-2010: 27% reduction in per capita water use (244 down to 178 gpcd) • 2013-2105: 25% reduction in per capita water use (173 down to 130 gpcd)
Augmenting Supply:Recycled Use in CA/U.S • Increased by > 300% since 1970 • Urban reuse (w/o IPR)~36% • Agricultural reuse ~ 31% • Significant efforts/expectations to increase reuse/recycling • Trends observed throughout U.S. PPIC (2019) SWRCB (2017) Tran, Schwabe, and Jassby (2016)
Irrigation efficiency and irrigated agriculture: A “Paradox”? Science (2018) => Govts spend $billions on subsidizing advanced irrigation technologies to “save” water => Provides water savings (private benefits) at farm scale => Rarely delivers public good benefits of increased water availability at basin-scale Why? Overlook nonconsumptive water => losses at farm-scale often recovered& reused at basin or watershed scale Two (among many) helpful “Fixes” • Acknowledge rebound effects • Implement a robust water accounting and measurement system Ward and Pulido-Velazquez (2008); Qureshi, Schwabe, Connor, Kirby (2010) Grafton et al. (2018)
Is there a similar “paradox” in municipal water policy/management? Question 1: Are supposedly efficient actions in one area of the “water portfolio” leading to inefficiencies in another area of the water portfolio? Question 2: What is the magnitude of the inefficiency on the system? Question 3: How has policy exacerbated or mitigated such a system inefficiency? Question 4: What can be done to operate the system more efficiency?
Are there unintended consequences from water conservation on recycling/reuse of wastewater? __________ Mitchell et al. (2017)
Are there unintended consequences from water conservation on recycling/reuse of wastewater? __________ Mitchell et al. (2017) • ________________ • (Tran et al. 2017)
Estimating Impact of Conservation Policies on WWTP Effluent Quality and Flow (Schwabe, Nemati, Amin, Tran, and Jassby) • Estimate two equations: • Monthly effluent as a function of: • monthly water deliveries to single family residential accounts • Conservation policy • Voluntary request period: June-2014 to May-2015 • Conservation mandate period: June-2015 to May-2016 • Self-certification period: June-2016 to May-2017 • Plant-level fixed factors • Season • Monthly TDS as a function of: • monthly effluent • Conservation policy • Plant-level fixed factors • Season • Data: 34 WWTPs in SoCal over 48 months (January 2013-December, 2017) • Regression (Statistical) Model: Fixed Effects OLS
WWTPs (34) Location & Corresponding Water Agency Flow Reductions
Monthly Relationship between Effluent Flows, GPCD, and TDS* _____________ * Relative to 2013
Voluntary (June 2014-May 2015) Mandate (June 2015-May 2016) Self-certification (June 2016-May 2017) Estimated Impacts of Conservation Policy on Effluent Flow and TDS • Conservation policies lead to: • (-) impact on effluent flows • Voluntary request • least impact • Conservation Mandate: • ~ 9% reduction • 4% to 16% range • (+) impact on TDS • Conservation mandate: • Likely largest effect • ~ 8.7% increase • 4.4% to 11.4% range
Cost-Effective Treatment to Mitigate Poorer Quality Influent During Drought: Regional Water Reuse Decision Support Model-RWRM (Tran, Schwabe, & Jassby 2016; 2017)
Summary • Recycling/reuse, conservation, and increasing water use are integral parts of California’s water portfolio to address water scarcity and drought • Evidence suggests that conservation efforts and the drought – including the state mandate –impacted wastewater treatment effluent flow and quality • “unintended” conservation efforts may • increase wastewater treatment costs • reduce recycling opportunities • impair surface water flows and qualities (especially in areas with effluent dominated streams) • Policy makers need to recognize the potential dependence of recycling on conservation, particular indoor water conservation