Download
1 / 72
750 likes | 916 Views
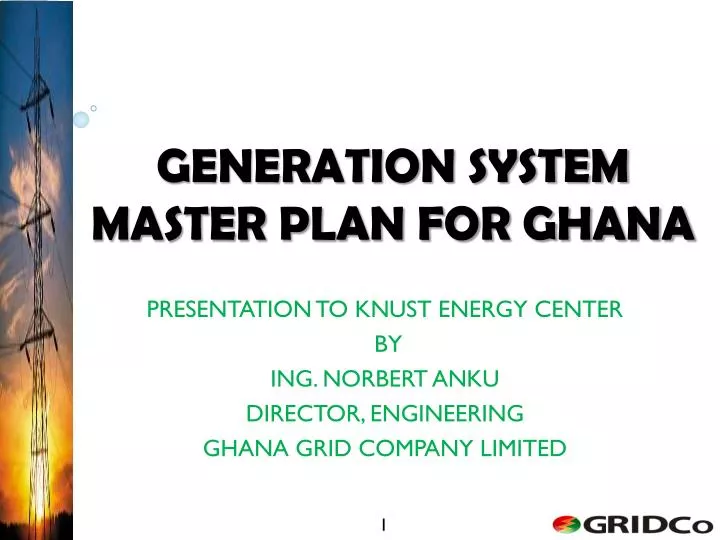
GENERATION SYSTEM MASTER PLAN FOR GHANA. PRESENTATION TO KNUST ENERGY CENTER BY ING. NORBERT ANKU DIRECTOR, ENGINEERING GHANA GRID COMPANY LIMITED. 1. Presentation Outline. Loads and Load Forecast Existing Generation Committed Generation Candidate Generation

E N D
GENERATION SYSTEM MASTER PLAN FOR GHANA PRESENTATION TO KNUST ENERGY CENTER BY ING. NORBERT ANKU DIRECTOR, ENGINEERING GHANA GRID COMPANY LIMITED 1
Presentation Outline Loads and Load Forecast Existing Generation Committed Generation Candidate Generation Generating Plant Technology and Facility Planning Criteria Results
Background and Objectives Aim: Presentation of the 15-year (2012-2026) Generation System Master Plan for Ghana. Purpose: To Guide Investment Basis: Using detailed load forecast, existing and committed facilities, optimal technology options, reserve margin and required reliability criteria.
Historical Demand Analysis Growth Rate VALCO Power Curtailments Suppressed Demand – 3% Losses
Load Forecast:Macroeconomic Parameters Gross Domestic Product (GDP) Population GDP per Capita
Data Collection: Existing Load Forecast Demand forecast is the main driver of the Generation Plan VRA EC ECG GRIDCo The VALCO Scenario
Load Forecast: Correlation Study Objective To identify a relationship between historic consumption and the macro-economic parameters. Methodology Multiple, least square linear regression to determine the linear relationship between one dependent variable (consumption) and one or more independent variables (macro-economic parameters)
Load Forecast: Correlation Study (contd.) Resulting relationship for Domestic Energy Forecast (GWh) = 2.35 * (GDP+1) - 144.82 * (Population) - ad 11.45*(GDP per capita)+ 2629.13
Global Forecast Based on various projected GDP and population growth rates, • Three Growth Scenarios Proposed • Low: 5.2% for system and 4.1% for domestic • High: 8.8% for system and 8.4% for domestic • Base Case: 6.7% for system and 6.3% for domestic • Load Factors/Utilization Factor: Percentage of time of utilization of peak load – 70%
Global Forecast (contd) System Load (MW) evolution 20122026 Base 1573 4161 Low 1457 2960 High 1692 5733
Demand Forecast (MW) Domestic Demand Forecast System Demand Forecast
Energy Forecast (MWh) Domestic Energy Forecast System Energy Forecast
Generation in Operation (Existing)-General (2011) Total Installed capacity: 2200 MW Dependable Capacity: 1900 MW Hydro:55% Thermal:45% All thermal plants are dual fired except Asogli
Operating Data: Technical and Economic Maintenance Period Forced Outage Variable O&M Cost Fixed O&M Cost Technical Minimum Loading Gradient
Hydro Generation Hydro generation – dominant: 55% of installed capacity Energy: 68% in 2010, 75% in 2009 and 53% in 2007. Firm hydro generation – 5300 GWh with 5% hydrological risk of failure. Dependable capacity for each unit at Akosombo 150 MW (wet) and 145MW (dry). For dry period value reduces to 140 MW
Committed Generation Concerns units/plants expected to be commissioned in the short term with in line dates fairly well known Expected addition by 2015: 1,552MW Expected addition by 2019: 1,780MW
Candidate Generation Units Potential generation plants in early development phase Enhanced by gas discoveries in Ghana
Thermal Power Plant Technology • Technology – Open cycle and combined cycle • Bi-fuel – natural gas and liquefied fuel(LCO or DFO) • Standard Sizes: • CCGT-60MW, 300MW, 450MW • GT- 45MW, 100MW, 150MW
West African Gas Pipeline 680 km long pipeline Connected at Takoradi and Tema VRA contracted to 120 MMSCFD Additional 120 request expected in 2019 By 2026, Ghana would have about 300 MMSCFD
Local (Indigenous) Gas From Jubilee Field Expected to last 20 years 120 MMSCFD of associated gas produced and a net of 80 MMSCFD. Jubilee Phase 2 by 2016 to yield 160 MMSCFD and 400 MMSCFD by 2025
Liquefied Natural Gas (LNG) Considered as a candidate fuel in competition with LCO, DDO, Coal, NG from Nigeria. No limitation imposed on LNG supply
Coal No coal powered power plant as yet Potential sizes: 125 MW and 250 MW Sizing Incident: 250 MW Coal is candidate to compete with LCO, DDO, LNG, NG No limitation of quantity.
Hydro Power • Next hydro Plant-Bui • Installed capacity of 400 MW and average available energy of 969 GWh • To be commissioned in 2013 • Other Potential Hydro Sites • Juale: 87 MW • Pwalugu: 48 MW • Hermang: 93 MW • Kulpawn: 36 MW • Daboya: 43 MW
Biomass Power generated from municipal solid waste, animal residues, industrial residues, sewage, agricultural crops and residues. Plant sites range from 5 to 20, 40, 50 and 100 MW Key challenge is sustainability
Wind • Two technologies considered • 2 MW units and 1 MW unit • Various wind sites are currently being investigated along the coast as well as inland • Wind cartography studies indicate the best site as in Techiman area (2588 GWh/y/installed MW). • Coastal sites have about 200 GWh/y/installed MW
Solar • Two technologies • Concentrated Solar Power (CSP) • Standard Size: 50MW. • Not suitable for regions with Direct Normal Irradiation of less than 2,000 kWh/m2/yr • Photovoltaic (PV) • Solar Plant – Converting solar radiation into direct current using semi-conductors. • Requires sunny environment
Nuclear • Nuclear power currently under investigation in Ghana to develop a 400 MW Plant by 2018. • This vision is not feasible • Period too short (10 years required) • Gas availability in Ghana • Incident size limitations (400-900 MW) • Public concern
Investment Costs • Combined Cycle, NG Fired Plants (300 MW) • USD 320 million to USD 400 million • Coal Fired Plant 125 MW: USD 314 million • Coal Fired Plant 250 MW: USD 540 million • Hydro • Bui: 400 MW: USD 622 million • Juale 87 MW: USD 309 million • Pwalugu 48 MW: USD 174 million • Hermang 93 MW: USD 250 million • Kulpawn 36 MW: USD 292 million • Daboya 43 MW: USD 202 million
Investment Costs Biomass 100 MW: USD 324 million 40 MW: USD 136 million 5 MW: USD 34 million Wind 25units x 2MW: USD 69 million 50units x 1MW: USD 81 million Solar CSP 50 MW: USD 507 million PV Plant 1 MW: USD 3.7 million
Planning Criteria – Reliability Criteria Reliability – ability of the system to meet the demand for power at any given time. Measured in terms of probability of failing to meet expected demand. Failure factors – random deviations of load, water shortage, forced outages of generating units, preventive maintenance, generator deratings etc.
Planning Criteria – Contd. The fraction of time that the available capacity is unable to meet the demand is known as loss of load probability (LOLP). Expected quantum of energy not served as a ratio of demand = Loss of Energy Probability (LOEP)
Planning Criteria – Contd. Installed Capacity Margin = (Dependable Installed Capacity – Peak Load) Peak Load
ReliabilityCriteria • Adopted reliability criteria drives and justifies all the investments. • Impacted by two main peculiarities of the Ghana System • Share of hydropower in generation mix • Private backup generation • LOLP is based on Cost of Unserved Energy (CUE) • If CUE is high – incentive for new generation • If CUE is low – system can afford lesser reliability – high LOLP
Reliability Criteria - Contd No unique CUE can be determined. Methods include • Production Loss • Willingness To Pay (WTP) • Generation Cost Based on various considerations, acceptable values for Ghana are • CUE: 1000USD/MWh (100cents per unit) • LOLP: 100h/year = 1.14%
Spinning Reserve Primary Reserve: Component of Ghana participation in the sizing incident currently at 90 MW. Current sizing incident is 150 MW (Akosombo unit) Sizing incident will increase in the advent of larger size machines such as 450 MW combined cycle plants resulting in incident sizes of 225 MW (1 GT + ½ ST) or 250 MW Coal Plant.