Download
1 / 5
50 likes | 170 Views
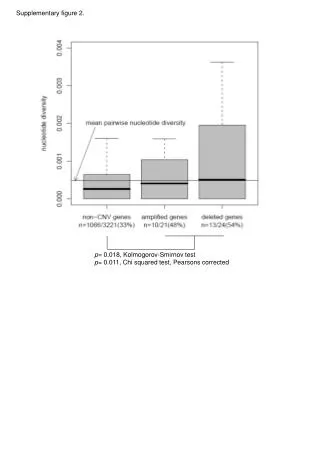
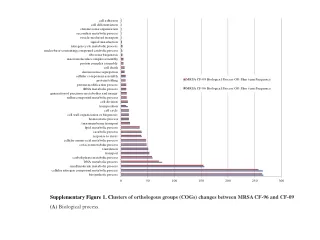
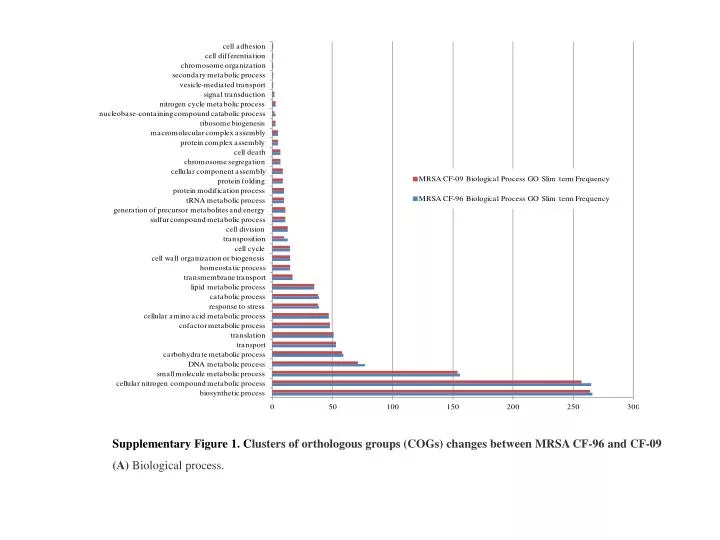
Supplementary Figure 1. C lusters of orthologous groups (COGs) changes between MRSA CF-96 and CF-09 (A) Biological process. Supplementary Figure 1. C lusters of orthologous groups (COGs) changes between MRSA CF-96 and CF-09 (B) Molecular functions.

E N D
Supplementary Figure 1. Clusters of orthologous groups (COGs) changes between MRSA CF-96 and CF-09 (A) Biological process.
Supplementary Figure 1. Clusters of orthologous groups (COGs) changes between MRSA CF-96 and CF-09 (B) Molecular functions.
Supplementary Figure 1. Clusters of orthologous groups (COGs) changes between MRSA CF-96 and CF-09 (C) Cellular components.
A Supplementary Figure 2. Monocytes purity and expression of TLRs (A) Human monocytes were isolated from healthy volunteers and were cultured as described in the Methods section. The cells were stained with indicated antibodies and analysed by flow cytometry; the percentages of positive cells are shown (n=8). (B and C) Human monocytes were exposed to CF-96, CF-09, HARMONY (Harmony) or nothing (none) for 16 hours. Then, cells were harvested and stained with (B) anti-TLR2 and (C) anti-TLR4-MD2. The g-mean of each staining is shown (n= 8). B C
A B Supplementary Figure 3. Monocytes from the patient exhibit a refractory state (A-D) Monocytes isolated from the patient and healthy volunteers (HV) were exposed to HARMONY (H) or saline (none) for 16 h. levels of (A) IL-1β, (B) IL-6, (C) IL-12p70 and (D) TNFα from the supernatant of monocyte cultures were then quantified by CBA; n = 3 for HVs and 2 replicas from the patient were used (mean values are shown). (E and F) Monocytes isolated from the patient and healthy volunteers were exposed to HARMONY or saline for the indicated time. (E) Cells were harvested and stained with TREM-1-FITC and CD14-APC, followed by flow cytometry analysis. The percentage of TREM-1 and CD14 positive cells are shown; n= 3 for HVs and two replicas from the patient were used (the mean values are shown). (F) sTREM-1 from the culture supernatants was quantified using ELISA; n= 3 for HVs and 2 replicas from the patient were used (mean values are shown). C D E F