Download
1 / 1
10 likes | 137 Views
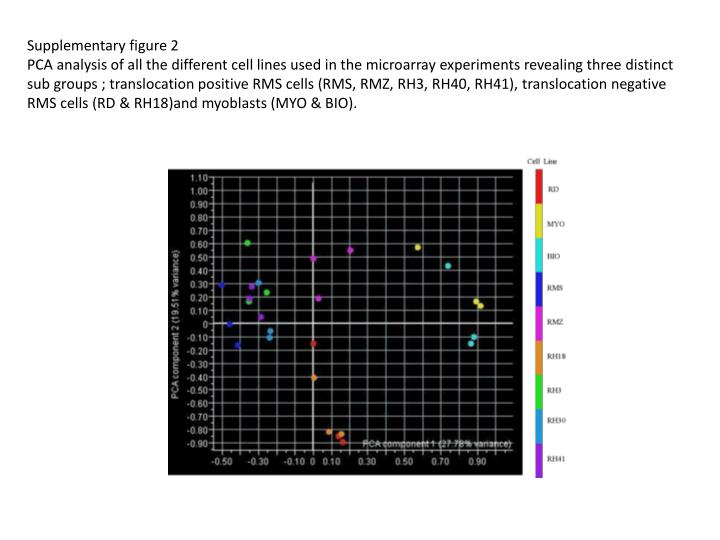
Supplementary figure 2 PCA analysis of all the different cell lines used in the microarray experiments revealing three distinct sub groups ; translocation positive RMS cells (RMS, RMZ, RH3, RH40, RH41), translocation negative RMS cells (RD & RH18)and myoblasts (MYO & BIO).

E N D
Supplementary figure 2 PCA analysis of all the different cell lines used in the microarray experiments revealing three distinct sub groups ; translocation positive RMS cells (RMS, RMZ, RH3, RH40, RH41), translocation negative RMS cells (RD & RH18)and myoblasts (MYO & BIO).