Download
1 / 32
330 likes | 473 Views
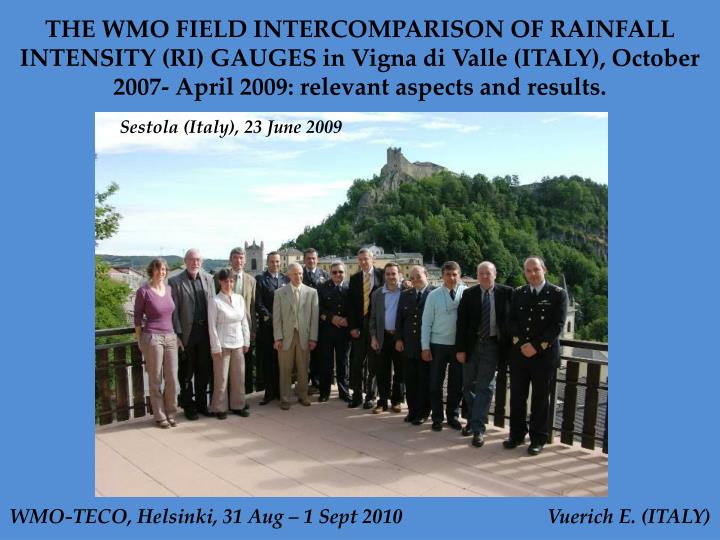
Sestola (Italy), 23 June 2009. THE WMO FIELD INTERCOMPARISON OF RAINFALL INTENSITY (RI) GAUGES in Vigna di Valle (ITALY), October 2007- April 2009: relevant aspects and results. WMO-TECO, Helsinki, 31 Aug – 1 Sept 2010 Vuerich E. (ITALY). CONTENTS.

E N D
Sestola (Italy), 23 June 2009 THE WMO FIELD INTERCOMPARISON OF RAINFALL INTENSITY (RI) GAUGES in Vigna di Valle (ITALY), October 2007- April 2009: relevant aspects and results. WMO-TECO, Helsinki, 31 Aug – 1 Sept 2010 Vuerich E. (ITALY)
CONTENTS • BACKGROUND AND OBJECTIVES • PROCEDURES AND METHODS • DATA ANALYSIS AND RESULTS • CONCLUSIONS AND DEVELOPMENTS • RECOMMENDATIONS THE INTERCOMPARISON TEST SITE ITALIAN MET SERVICE – AIR FORCE (IMS) CENTRE OF MET EXPERIMENTATIONS (RESMA) VIGNA DI VALLE ITALY
BACKGROUND • Following the increased recognition of scientific and practical issues related to the assessment of possible climatic trends, the mitigation of natural disasters (e.g. storms and floods), the hindering of desertification, the attention paid to accuracy and reliability in rainfall measurements is currently increasing • The WMO recognized these emerging needs and promoted a couple of mile-stone meetings: • - (1) Bratislava, Slovak Republic, 23-25 April 2001: calibration of rain gauges and general aspects of measurements (I phase: WMO Laboratory Intercomparison of RI gauges, 2004-2005) • - (2) Geneva, Switzerland, 5-9 December 2005: operational aspects of field measurements and achievable accuracy (II phase: WMO Field Intercomparison of RI gauges, 2007-2009)
BACKGROUND • Previous WMO intercomparisons: accumulated amounts, on low RI or on snowfall, on qualitative information • The WMO FI-RI gauges started in Vigna di Valle (Italy) at the IMS Centre of Met Experimentations on the 1st of October 2007 and, after a 6-months extension, it was concluded in April 2009 (first intercomparison for quantitative 1MIN-RI) • Main objective: to assess and compare quantification and catching errors of both catching and non-catching type of RI gauges with the emphasis on high rainfall intensity in order to complain with the WIGOS basic concepts of improving standardization, data homogeneity, data quality, compatibility, interoperability. • Other tasks: providing draft recommendations for CIMO and guidance material for inclusion into the CIMO guide.
PROCEDURES AND METHODS • 30 RI gauges (4 working references) capable to measure RI up to 200mm/h at 1min resolution were selected, randomly distributed (avoid clustering of large gauges) and installed on dedicated ground platforms at 1 m height (no windshields) • 13 additional meteorological sensors were installed in later positions for monitoring environmental conditions.
PROCEDURES AND METHODS List of participating rain gauges (26+4 working references)
CAE-PMB2 MeteoservisMRW500 GEONORT200B ETG-R102 PROCEDURES AND METHODS • 4 Reference gauges, the “Composite Working Reference ” (C.W.R.) were inserted in Reference Rain Gauge Pits (R.R.G.P.) at the centre of the Intercomparison site (collectors at ground level) – Minimization of weather related catching errors (e.g. Jevons effect, 1861) • Standard adopted: ISO/EN-13798: “Specification for a reference rain gauge pit”, recently revised in 2010 CWR(Recom. 3 CIMO-XIV): corrected tipping bucket rain gauges (TBRG) and weighing gauges (WG) with the shortest step response and the lowest uncertainty according to Results of WMO Laboratory Intercomparison of RI 2004-2005.
PROCEDURES AND METHODS • 20 catching type gauges were calibrated in the laboratory before the Field Intercomparison. The WMO recognized laboratory at the University of Genoa performed the calibration based on the generation of a constant water flow from a reference hydraulic device (tests according to Recom.2 CIMO-XIV + statistics based on 1 min evaluation of relative errors ) • Objectives: to single out the quantification errors associated with each instrument; measurement uncertainty and understanding of field results Reference hydraulic device The Qualification Module for RI Measurement Instruments developed at the University of Genova (Ur(95%)=0,45%)
PROCEDURES AND METHODS • Lab tests: reference flow rates at 2, 20, 50, 90, 130, 170, 200 mm/h at 1MIN resolution for a variable duration, arithmetic mean of relative errors and spreading of data around it, providing correction curves (to be used beyond the intercomp. time) • Results: the constant flow response plot, gaugerelative error plotted versus Lab reference RI (superimposed box-plots)
PROCEDURES AND METHODS • Further lab tests: investigation of the dynamic performance gauges at 1MIN resolution through the evaluation of the step response to a step input (time constant) which is a measure of the instrument stability and ability to detect rapid changes of the input signal. • Results: step response plot, ratio of measured RI / Lab Reference RI versus time.
Meeting of Participants Field Tests-Calibration Device PROCEDURES AND METHODS • Quality assurance: • Raw data are processed by the Automatic Quality Control (AQC) to provide quality checked 1-minute data • Periodic field tests: Field Calibration Device (developed at DICAT Laboratory – Univ. of Genoa) – Metrological confirmation • Periodic maintenance, daily visual checks, cleaning of instruments, calibration status checks • Meeting of Participants and local staff (Vigna di Valle, 21-22 MAY 2008) – HMEI participated and reported • QA reports by the Site Manager to the ET.
DATA ANALYSIS AND RESULTS • Analysis dataset: 1MIN-QC checked RI data obtained through the reduction of the full FI dataset (162) by considering only synchronized events and events with 2 consecutive minutes and RI>12mm/h (totally 43 events, approx. 740 data). • No. 2 events with RI > 150mm/h; No. 5 events with RI>100mm/h; No. 15 events with RI>60mm/h …..
DATA ANALYSIS AND RESULTS 4 Nov 2008 • Main objective: performing the best inter-comparison of rain gauges in high RI field conditions through the determination of a reference value (1MIN RIref) • RIref is the best estimation of the 1 min RI true value and it must be derived through a RI Composite Working Reference value.
DATA ANALYSIS AND RESULTS • Method: weighted average of 1-min RIi measured by the 4 reference gauges • Weights (µi, working reference gauge i) werethe most challenging issue, since they must take into account effects related both to dynamical characteristics and possible lack of synchronization on 1 min time base • Si are 3 statistical parameters calculated throughout the database of all precipitation events • F = 0,1: “gross” parameter, for each working reference and for each event (F=1 if the working ref is not affected by 1-min lack of synchronization or high dynamic oscillation) (k≠i) F=0,1
DATA ANALYSIS AND RESULTS GEONOR- T200B CAE-PMB2 ETG-R102 M-S MRW500
DATA ANALYSIS AND RESULTS • Synchronization: to compare the 1-min RI data of all instruments, a synchronization of ±10 s was required, in other words the internal clock of the instrument should be within ±10 s compared to the DAQ system timestamp (nominal timestamp). If the difference/delay between the instrument’s data output time and the nominal timestamp exceeds the required ±10 s time interval, the result cannot be correctly compared to synchronized gauges. Gauge A and C are synchronized with the DAQ system clock; gauge B has a delay exceeding 10 seconds. Arrows indicate sample points of B with large difference due to non-synchronized data points of gauge B.
DATA ANALYSIS AND RESULTS • Uncertainty of the reference: assuming a normal distribution of the deviations of pit gauges RI, the standard deviation of the distribution with respect to the reference intensity is calculated according (σ=[∑(RI-RIref)2/N]1/2); thus U95(RIref)=2 σ=4.3mm/h • Relative uncertainty: ur(RIref)= (U(RIref) / RIref )∙100 [%] (green in plot)
DATA ANALYSIS AND RESULTS • To show the general results of the intercomparison, the intensities measured by the rain gauges are plotted versus 1MIN Riref (CWR) and data are fitted with a power law trend curve RI=a x RIrefb (corresponding bet fit equation reported on graphs) • To assess the accuracy of field measurements compared to the reference, a tolerance region (composed of the WMO required 5% uncertainty and of the uncertainty of the reference, calculated as [urel(RIref)2+52]1/2 [%] ) is represented in dashed lines on each plot. • For easier comparison, the instruments have been divided into seven groups according to the measurement principle, as indicated in the title of each plot. WG instruments are split in two groups for easier presentation of results. • Specific results and plots: Data Sheets included in the Final Report • To assess the impact of wind losses (Jevons effect) on catching errors, the ratio RIiOUT/ RIi is plotted versus wind speed (being RIiOUT and RIi the measured intensities by two identical gauges, one in the pit and the other one in the corresponding open field platform)
DATA ANALYSIS AND RESULTS TBRG-SC
DATA ANALYSIS AND RESULTS TBRG-PC
DATA ANALYSIS AND RESULTS TBRG-MC & LRG
DATA ANALYSIS AND RESULTS WG (1)
DATA ANALYSIS AND RESULTS WG (2)
DATA ANALYSIS AND RESULTS Non catchingtyperaingauges
DATA ANALYSIS AND RESULTS Measurement accuracy of all gauges by relative deviations from RIref
DATA ANALYSIS AND RESULTS A relevant effect of the wind did not appear in this intercomparison, we are able to affirm that the wind is not affecting in a significant way the outer instruments compared to those installed in the pit.
CONCLUSIONS AND DEVELOPMENTS • This comparison at 1MIN time scale in field conditions demonstrates the possibility to evaluate the performance of RI gauges, identifying directions where research and technological development should be oriented. • The achievable accuracy of WG can be improved in field conditions by means of the reduction of the response time below 1-minute and by appropriate filtering methods • With regard to TBRG, the method applied by TBRG-SC confirms the possibility to improve the 1-min RI resolution and to provide accurate field measurements • With regard to TBRG, the method applied by TBRG-PC revealed the possibility to provide accurate field measurements at higher RI, even if the performance is limited by their resolution at lower RI. • With regard to non catching type rain gauges, despite the need of very low maintenance and the possibility to determine the type of precipitation (not for all), none of them agreed well with the reference. We are confident that their performance will be improved in the next future, considering the possibility of improving calibration methods to reduce systematic errors.
CONCLUSIONS AND DEVELOPMENTS • Disdrometers tended to overestimate the RI. Despite their very different calibration procedures, they agreed better to each other than to the reference, as indication of a good degree of precision but they were not as accurate as conventional gauges • For the best quality instruments, the achievable measurement uncertaintyin laboratory, under constant flow conditions, was found to be 5% above 2 mm/h and 2% above 10 mm/h. • One of the most challenging aspects of the Intercomparison was the definition of a 1-minute field reference intensity. The procedure adopted confirmed the suitability of R102-ETG, PMB2-CAE and T200B-GEONOR for the calculation of the reference. • The rainfall intensity is highly variable from minute to minute. Therefore, the time synchronization of the instruments is crucial to inter-compare their measurements and to design the measurement systems. • The results of the intercomparison confirmed the feasibility to measure 1MIN RI and provided information on the achievable measurement uncertainties, responding to the need of accuracy, homogeneity and standardization of RI measurements, as required by WIGOS.
CONCLUSIONS AND DEVELOPMENTS • In field conditions, the uncertainty of the RI CWR was evaluated to be 4.3 mm/h. Consequently, the relative uncertainty of the reference was found to be below 5% only for intensities above 90 mm/h. Below 90 mm/h, the relative uncertainty of the reference values was higher than the 5% required measurement uncertainty provided in the CIMO Guide. • A number of standardization activities at national and European level (CEN- TC “Hydrometry”)) has been promoted by the Italian Met Service, such as a national standard on the classification of rain gauges according to accuracy, the revision of the standard “Specification for a reference rain gauge” (ISO/EN13798:2010), a pre-standard (CEN technical report) on RI measurements (a possible WMO/ISO common standard in future) • The IMS proposed the establishment of a CIMO Lead Centre on precipitation intensity (Univ. Genova, Vigna di Valle, M.Cimone).
RECOMMENDATIONS (3 of 18) • The 1-min RI is highly variable from minute to minute. Therefore, it is recommended that 1-min RI should only be measured in a station and used for further analysis if the following conditions are met: (a) All 1-min data must be transmitted and used (a single 1-min RI value is not representative of a longer period of time; (b) A very good time synchronization, better than 10 s, must be achieved, both between the reference time and the different instruments of the observing station. • Changes be made to the CIMO Guide Table: • Precipitation intensity (liquid): • Achievable measurement uncertainties: • Under constant flow conditions in laboratory, 5% above 2 mm/h, 2% above 10 mm/h. • In field conditions, 5 mm/h, and 5% above 100 mm/h • It is recommended that RI measurements be further standardized based on the advances in knowledge obtained from this intercomparison to allow the users to obtain homogeneous data sets (based on the achievable RI measurement performance (accuracy) rather than on measuring principle or gauge design/technical solutions)
ACKNOLEDGEMENTS The ITALIAN MET SERVICE – AIR FORCE The WMO-CIMO (Dr Ondras, Dr Ruedi) The colleagues, local staff of the intercomparison site (Vigna di Valle) Dr Claudia Monesi – Univ. of Rome TRE (data analyst) Dr Eckhard Lanzinger – DWD (The project Leader) Dr Bruce Baker –USA (ET member) Dr Michel Leroy – Meteo France (ET chair) And Prof. Luca Lanza and Eng. Luigi Stagi – Univ. of Genova