Download
1 / 23
250 likes | 501 Views
Social Statistics: Correlation. This week. What is correlation? How to compute? How to interpret?. Correlation Coefficients. The relations between two variables How the value of one variable changes when the value of another variable changes

E N D
This week • What is correlation? • How to compute? • How to interpret? S519
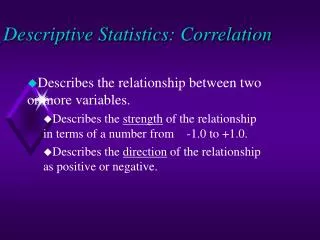
Correlation Coefficients • The relations between two variables • How the value of one variable changes when the value of another variable changes • A correlation coefficient is a numerical index to reflect the relationship between two variables. • Range: -1 ~ +1 • Bivariate correlation (for two variables) S519
Correlation Coefficients • Parametric • Pearson product-moment correlation (named for inventor Karl Pearson) • Non-parametric • Spearman’s rank correlation • Kendall tau rank correlation coefficient S519
Pearson correlation coefficient • For two variables which are continuous in nature • Height, age, test score, income • But not for discrete or categorical variables • Race, political affiliation, social class, rank Rxy is the correlation between variable X and variable Y S519
Types of correlation coefficients • Direct correlation (positive correlation): • If both variables change in the same direction • Indirect correlation (negative correlation): • If both variables change in opposite directions • See table 5.1 (S-p112) • -0.70 and +0.5, which is stronger? S519
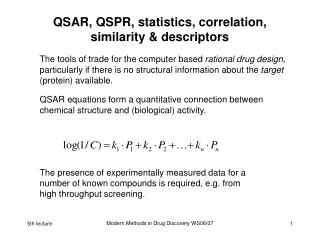
Pearson product-moment correlation coefficient The correlation coefficient between X and Y n the size of the sample X the individual’s score on the X variable Y the individual’s score on the Y variable XY the product of each X score times its corresponding Y score X2 the individual X score, squared Y2 the individual Y score, squared S519
Exercise • Calculate Pearson correlation coefficient 1.Is variable X and variable Y correlated? 2. What does this correlated mean? S519
Using Excel to calculate • CORREL function • Or Pearson function S519
Visualizing a correlation • Scatterplot or scattergram Y X S519
Direct (positive) correlation • r =1, a perfect direct (or positive) correlation • In real life case, 0.7 and 0.8 could be the highest you will see S519
Indirect (or negative) correlation • Strength and direction are important S519
Excel Scatterplot Four sets of data with the same correlation of 0.816 S519
Linear correlation • Linear correlation means that X and Y are in one straight line • Curvlilinear correlation • Age and memory S519
More than 2 variables? • CORREL() • Correlation in data analysis toolset How to calculate the correlation coefficient? S519
More than 2 variables? • Correlation matrix S519
Excel • Data Analysis tool - correlation S519
Meaning of Correlation coefficient • Correlation value: • - finite number ~ + finite number • Correlation coefficient value: • -1.00 ~ +1.00 S519
Coefficient of determination • Coefficient of determination: • The percentage of variance in one variable that is accounted for by the variance in the other variable. • = square of coefficient 49% of the variance in GPA can be explained by the variance in studying time S519
Coefficient of nondetermination • The amount of unexplained variance is called the coefficient of undetermination (coefficient of alienation) S519
Ice cream and crime • In a small town in Greece, • The local police found the direct correlation between ice cream and crime S519
Correlation vs. causality • The correlation represents the association between two or more variables • It has nothing to do with causality (there is no cause relation between two correlated variables) • Ices cream and crime are correlated, but • Ices cream does not cause crime S519