Download
1 / 22
230 likes | 764 Views
Social Justice and Statistics. Craig Russell University of Illinois Laboratory High School NCTM Chicago 2006. Background & Motivation. Teaching Experiences Mathematical Modeling/COMAP/MMOW Math for a World that Rocks “Models in the Media” Statistics Analysis Papers Research

E N D
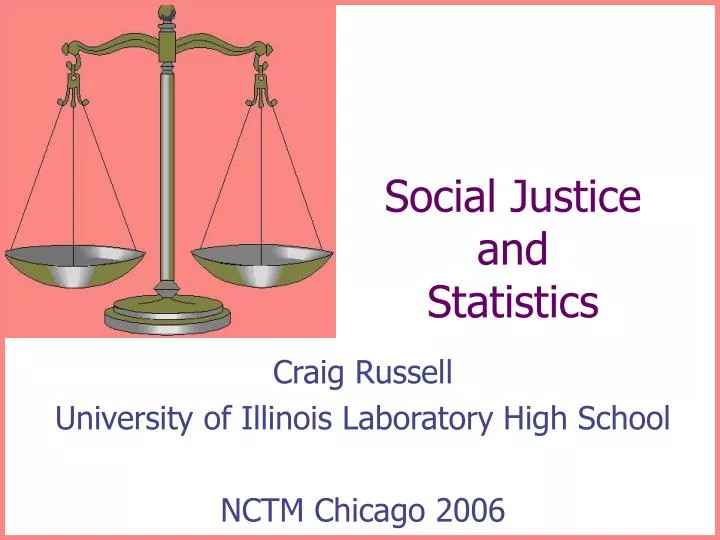
Social JusticeandStatistics Craig Russell University of Illinois Laboratory High School NCTM Chicago 2006
Background & Motivation • Teaching Experiences • Mathematical Modeling/COMAP/MMOW • Math for a World that Rocks • “Models in the Media” Statistics Analysis Papers • Research • Anastasia Brelias • School Climate • Community service; annual Habitat trip • Social Advocacy class
Learning Standards • NCTM: • Connections: “Recognize and apply mathematics in contexts outside of mathematics” • Data Analysis and Probability: All expectations • Illinois Learning Standards: • Applications: Communicating and making connections • Goals 10A & B: “Collect, organize and analyze data using statistical methods [and] predict results…”
Curriculum Context • Statistics is one of four full-year elective courses beyond Algebra 2/Trig; students must take at least one. Other courses include Pre-Calculus and two years of Calculus. Some students take Statistics to avoid more rigorous mathematics; some take Statistics concurrently with another math course. • The course covers all the material tested on the Statistics Advanced Placement exam; some students take the AP each year.
Statistics Course “Syllabus” • Major blocks of study: • Descriptive Statistics • Fundamentals of Probability • Design of Experiments • Inferential Statistics • Assessments: • Problem sets/exams/quizzes • Analysis Papers • Lab Reports (individual) • Projects (individual, pair, triple) • Blog??? Online discussion??? Handout includes social justice activities keyed to each major block.
Social Justice • Definition? • Scope? • Do students understand the concept? • Students have a schoolyard concept of fairness, and are (at least superficially) aware of some issues related to social justice. • At the outset, students have been unable to articulate even an informal definition of social justice.
Student Involvement • Day 1: Introduction to course included a definition of Statistics as a tool for making sense of the world; students were told that the year would include a “focus on social justice.” We discussed (briefly) what that might mean. • Week 1: As part of the first problem set, students were to research the meaning of the term “social justice” and write down their own working definition (with references cited)
Further Student Involvement • General discussions • Use of data sets in student assignments • Use of data sets related to social justice issues in class lecture/discussion • Guest speaker “colloquia” from community or other groups
Social Justice Discussions • Classroom discussions: genocide, Hurricane Katrina, Kashmiri earthquake, NCLB, affirmative action/college admissions, others according to student interest • Method: Introduce topic at the end of a lesson (last 10 minutes of class), continue discussion for 10-15 minutes the next day. • General class discussions about once every two weeks (sometimes more often, especially during the aftermath to Katrina)
Discussion Ground Rules • How does the definition of “social justice” fit? • Is there a way to measure fairness? • What kind of data would you like to be able to collect? • What variables and/or factors contribute to the situation? How are they related—cause and effect?—explanatory?—response? • Are there different “sides” to the issue?
Lab Activities • Statistics skills involve data; why not choose relevant data for the students to work with? • Graphical representations • Transformations of data • Correlation and regression • Confidence intervals • Hypothesis tests • In the lab write-up, students address social justice and mathematical issues.
Data Interpretation Exercise • Match the group with the graph… data shows mortgage refusal rates for 20 large banks. • High-income white • High-income minority • All white • All minority • Where’s the fairness? Graph from DASL web site
Classroom Activities • Modeling situations: • Identifying variables • Formulating hypotheses • Designing experiments/surveys • Interpreting data and representations of data • Role play • All of these can be done in a social justice context!
A Sample Activity: Confidence Intervals • Groups of 3-4 students are given different settings; they work together to identify confidence intervals and decide on an appropriate confidence level in order to make a recommendation. They are told to prepare statistical arguments for both sides of the issue. After working together for some time, groups present their findings to the class; the class discusses social justice implications.
Confidence, Statistics, and Social Justice • Each group has several scenarios. In each scenario, answer the mathematical part using techniques we have discussed in the past week and a half. Answer the “social justice” part by reasoning out, considering different viewpoints (at least TWO different viewpoints per scenario), adopting a viewpoint if one is not suggested, and answering the question. Be prepared to either DEFEND your answer, or to CRITIQUE answers of other groups. • After a while, I will assign one scenario presentation to each group; for now, consider EACH scenario.
Problem-Based Learning • The idea behind PBL is to give students a realistic, large, ill-posed problem, from which they extract meaningful questions, do appropriate research, then present solutions (IMSA’s web site has a great description). • Social justice issues can provide an ideal PBL setting for Statistics projects, whether on a grand or limited scale. • Example: the Illinois legislature requires the study of genocide in the curriculum (Public Act 94-0478). Where? Why not in Statistics?
Student Work: Projects • 1st Semester: • Interview with scientist/social scientist about experimental design • Statistical synopsis of local social service agency • 2nd Semester: • Design, conduct, and analyze an experiment (or analyze a large data set collected externally) • What I Could Have Done (and did, after the AP exam, instead of a unit on ANOVA): • Social justice project (abbreviated)
Projects with Social Justice Flavor(by student choice) • NCLB survey of elementary teachers in local district… (fall 2004) • Career interview with sociologist (fall 2004) • Statistical overviews of work done by Habitat for Humanity, Planned Parenthood, El Centro, and a homeless shelter (fall 2004, fall 2005) • Analysis of bullying survey data collected by the counseling office (spring 2005) • Minority enlistment in the military (fall 2005) • Sex education in public schools (spring 2005)
Social Justice Project • Brainstormed social justice issues as a class • Individuals took an issue and formulated questions with a statistical basis • Students put together an annotated bibliography relevant to their issue • Students chose one question to study; they collected information and used it to “tell a story.” In addition, they documented their research process and thinking as part of the project.
Project Results • Affirmative Action • Birth Control: Pharmacist’s Choice? • Access to abortion • Illegal immigration • Health care costs in the U.S. • Minimum wage • Public funding for sports arenas • Socio-economics of military recruiting
More Brainstorming • Immigration reform • Patriot act and racial/ethnic profiling • Kyoto Protocol and global warming • Iran and North Korea as nuclear powers • Oil Prices: Where does the money go? • Medicare Prescription Drug Plans • CEO Salaries (or pro athlete, coaches, celebrities, etc.) • Philanthropy: Gates Foundation & others
What’s Next? • Continuing this year… More guest speakers? New data sets? New questions? • Students reported that the social justice focus in 2005-2006 made the Statistics class much more relevant. • Is a thematic focus (whether social justice or other topic) appropriate for any math course? • Is an open-ended problem solving approach (PBL or other) appropriate for any math course? • I welcome any suggestions or feedback (my contact info is on the handout). Thanks for stopping in… Enjoy the conference!