Download
1 / 20
200 likes | 287 Views
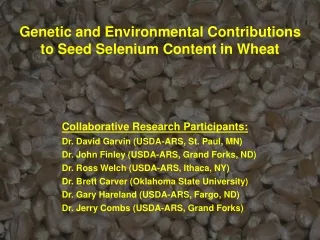
Genetic and Environmental Contributions to Seed Selenium Content in Wheat. Collaborative Research Participants: Dr. David Garvin (USDA-ARS, St. Paul, MN) Dr. John Finley (USDA-ARS, Grand Forks, ND) Dr. Ross Welch (USDA-ARS, Ithaca, NY) Dr. Brett Carver (Oklahoma State University)

E N D
Genetic and Environmental Contributions to Seed Selenium Content in Wheat Collaborative Research Participants: Dr. David Garvin (USDA-ARS, St. Paul, MN) Dr. John Finley (USDA-ARS, Grand Forks, ND) Dr. Ross Welch (USDA-ARS, Ithaca, NY) Dr. Brett Carver (Oklahoma State University) Dr. Gary Hareland (USDA-ARS, Fargo, ND) Dr. Jerry Combs (USDA-ARS, Grand Forks)
Sources of Se in U.S. Diets wheat – 141 pounds corn – 30 pounds rice – 22 pounds Grain Products – 40% Meat/Poultry/Fish – 29% Dairy – 12% Legumes/Nuts – 7% Eggs – 6.5% Sources: --Gerrior and Bente. 2002. Nutrient Content of the U.S. Food Supply, 1909-1999: a summary report. USDA Home Economics Research Report No. 55. --USDA National Agricultural Statistics Service. 2004. Agricultural Statistics 2004. http://www.usda.gov/nass/pubs/agr04/04_intro.pdf
Can We Genetically Improve Se in Wheat? Does genetic variation exist? Environmental effects? Associations with other traits?
Has Selection for Increased Productivity Altered Se Content? Research Collaborators: Ross Welch, John Finley
U.S. Wheat Production - Approximately 2 billion bushels produced annually - Major production region is the Great Plains - The main class grown is hard red winter wheat (HRWW) -late 1800’s: introduction from Ukraine (‘Turkey’) -modern breeding efforts began in the early 1900’s -genetic improvement of yield approximately 1% yr-1 Source: Carver et al. 2001. The hard red winter wheat pool. In: The World Wheat Book. Lavoisier, Paris.
Donmez et al. 2001. Crop Sci. 41: 1412-1419 -14 landmark HRWW varieties from late 1870’s to present - analysis of changes in yield and yield components Trends in seed mineral concentrations associated with yield improvement should be revealed in this material
Seed Mineral Analysis - seed from 1998-1999 growing season - two locations (Hutchinson/Manhattan, KS) - 4 reps genotype-1 location-1 HutchinsonManhattan Elementa Mean Range Mean Range Se 0.36*** 0.28-0.48 0.045 0.04-0.055 Fe 31.4*** 24.4-42.8 33.7* 30.2-38.3 Zn 20.9*** 16.0-26.3 29.3* 26.1-33.9 a ug g-1 -significant differences between varieties at each location -significant differences in seed mineral concentrations btwn locations Seed kindly supplied by Dr. Allan Fritz, KSU
r = n.s. Hutchinson Manhattan Significantly lower than Turkey r = 0.72** r = 0.78**
Association Between Seed Se and Yield Hutchinson Manhattan r = n.s. r = n.s. but, regression on date of release is significant R2 = 0.52 0.09 ng g-1 yr-1 R2 = 0.31 1 ng g-1 yr-1 (yield data from Donmez et al. 2001. Crop Sci. 41: 1412-1419)
Association Between Seed Fe and Zn Concentrations and Yield (Hutchinson) r = -0.57* r = -0.85*** Mean decrease per year: 0.07 ug g-1 (R2=0.61) Mean decrease per year: 0.1 ug g-1 (R2=0.49) (yield data from Donmez et al. 2001)
What are relative contributions of genetics and environment to wheat seed Se concentration? Research Collaborators: Brett Carver, John Finley
The U.S. Wheat Uniform Regional Performance Nursery System • evaluates new wheat germplasm • from breeding programs • annual program, genotypes grown • at many locations • separate nurseries for different • wheat market classes
* * * * * * * * * * * * * * * Evaluation of Seed Se Concentrations in Uniform Hard Red Winter Wheat Nursery - analysis from two growing seasons (01-02, 02-03) - same 12 genotypes at each location and in both years
Relative Impact of Environment vs. Genotype on Seed Se (01-02 Season) p<0.05 Range: 421-591 ppb 0.40-fold difference p<0.0001 Range: 86-1075 ppb 12.5 fold difference * *
Association Between Seed Se and As r = -0.26*** -each data point is a single genotype at a single location-
Components of a Wheat Seed pericarp/testa/aleurone (bran) endosperm (flour) embryo (germ) Flour: 70% of seed weight protein ca. 4% cysteine + methionine (Sources: Finney et al. 1987; Wrigley and Beitz, 1988)
Is Se distribution/composition altered in high Se wheat seeds? Does high seed Se alter end-use quality of wheat? Research Collaborators: John Finley, Gary Hareland, Jerry Combs
High Se and Alterations in Seed Se Distribution Common hard red winter wheat – high Se and low Se grain mill into different fractions Se analysis Do spatial patterns of Se accumulation change in response to high Se? Differences in which Se compounds accumulate?
Impact of High Se on End-Use Quality high Se/low Se hard red winter wheat flour -comparative evaluation of physical/chemical properties of flour -breadmaking evaluations any detrimental effect of high Se on quality? does breadmaking affect Se content/speciation?
Overall Conclusions > Wheat seed Se is principally determined by location > Genotypic differences in wheat seed Se exist but are modest and appear to show significant GxE interaction > Genotypic differences in wheat seed Se are associated with yield differences > High seed Se is not associated with high seed As > Effect of high seed Se on spatial distribution and end use quality are now being evaluated Acknowledgements: Brian Gregoire (USDA-ARS, Grand Forks) Larry Heller (USDA-ARS, Ithaca) Joel Mason (USDA-ARS, St. Paul)