Download
1 / 43
430 likes | 579 Views
Field Mapping. V. Blackmore CM38 23rd February 2014. Mapped Currents. Contents. Survey plots presented at CM37. Today: Effect of the shielding plate Linearity of field with current Residual magnetic field Probe Jitter Hysteresis? Magnetic axis fits.

E N D
Field Mapping V. Blackmore CM38 23rd February 2014
Mapped Currents Contents Survey plots presented at CM37. Today: Effect of the shielding plate Linearity of field with current Residual magnetic field Probe Jitter Hysteresis? Magnetic axis fits • Runs cover the above currents, plus: • 0A measurements (residual field) • 30A individual coil measurements (superposition) • With and without Virostek plate A lot of data
Co-ordinate Systems Until the end of this talk...
The “Mapper” Co-ordinate System Mapper: Movement example video* • To avoid changing too many variables at once, all of the data (until it says otherwise) is in the “mapper co-ordinate system.” • No survey corrections (as described at CM37) have been applied. Mapper: Rotation example video * “Spectrometer Solenoid” *Thanks to F. Bergsma “Upstream” end and Virostek Plate Hall probe card Probes numbered from 0 to 6 in order of increasing radius Probe “0” on axis “Conveyor belt” “Carriage”
The “Mapper” Co-ordinate System Mapper: Movement example video • To avoid changing too many variables at once, all of the data (until it says otherwise) is in the “mapper co-ordinate system.” • No survey corrections (as described at CM37) have been applied. Mapper: Rotation example video
The “Mapper” Co-ordinate System Mapper: Movement example video • To avoid changing too many variables at once, all of the data (until it says otherwise) is in the “mapper co-ordinate system.” • No survey corrections (as described at CM37) have been applied. Mapper: Rotation example video Tick! In file for : Record probe number,
The “Mapper” Co-ordinate System Mapper: Movement example video • To avoid changing too many variables at once, all of the data (until it says otherwise) is in the “mapper co-ordinate system.” • No survey corrections (as described at CM37) have been applied. Mapper: Rotation example video Tick! In file for : Record probe number,
The “Mapper” Co-ordinate System Mapper: Movement example video • To avoid changing too many variables at once, all of the data (until it says otherwise) is in the “mapper co-ordinate system.” • No survey corrections (as described at CM37) have been applied. Mapper: Rotation example video Tick! In file for : Record probe number,
The “Mapper” Co-ordinate System Mapper: Movement example video • To avoid changing too many variables at once, all of the data (until it says otherwise) is in the “mapper co-ordinate system.” • No survey corrections (as described at CM37) have been applied. Mapper: Rotation example video Rotate! Tick! Start new file for : Record probe number,
The “Mapper” Co-ordinate System Mapper: Movement example video • To avoid changing too many variables at once, all of the data (until it says otherwise) is in the “mapper co-ordinate system.” • No survey corrections (as described at CM37) have been applied. Mapper: Rotation example video Reverse!
The “Mapper” Co-ordinate System Mapper: Movement example video • To avoid changing too many variables at once, all of the data (until it says otherwise) is in the “mapper co-ordinate system.” • No survey corrections (as described at CM37) have been applied. Mapper: Rotation example video Tick! In file for : Record probe number,
The “Mapper” Co-ordinate System Mapper: Movement example video • To avoid changing too many variables at once, all of the data (until it says otherwise) is in the “mapper co-ordinate system.” • No survey corrections (as described at CM37) have been applied. Mapper: Rotation example video Tick! In file for : Record probe number,
The “Mapper” Co-ordinate System Mapper: Movement example video • To avoid changing too many variables at once, all of the data (until it says otherwise) is in the “mapper co-ordinate system.” • No survey corrections (as described at CM37) have been applied. Mapper: Rotation example video Rotate! Tick! Start new file for : Record probe number,
The “Mapper” Co-ordinate System Mapper: Movement example video • To avoid changing too many variables at once, all of the data (until it says otherwise) is in the “mapper co-ordinate system.” • No survey corrections (as described at CM37) have been applied. Mapper: Rotation example video Forward! etc. etc.
The “Mapper” Co-ordinate System Mapper: Movement example video • To avoid changing too many variables at once, all of the data (until it says otherwise) is in the “mapper co-ordinate system.” • No survey corrections (as described at CM37) have been applied. Mapper: Rotation example video • Each data “set” is taken over the same range of in the same number of steps, and similarly for • Each is recorded in a separate data file • I do combine these files • I do rotate , and keep • are what the mapper reports Forward! etc. etc.
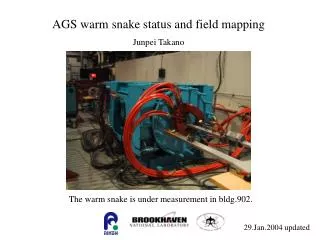
* Mapper m Mapper at this side The Shielding Plate Compare identical measurements with and without the shielding (“Virostek”) plate “Identical”: Exactly the same points taken at the same currents *Photographs gratuitously stolen from S. Virostek’s talk at CM36
Spot the Shielding Plate Let’s play • “On-axis” probe, plotting (i.e. ) w.r.t. mappers recorded position at 4 angles of • Measurements at 50% current, Solenoid Mode (will come back to linearity)
Spot the Shielding Plate Let’s play • “On-axis” probe, plotting (i.e. ) w.r.t. mappers recorded position at 4 angles of • Measurements at 50% current, Solenoid Mode (will come back to linearity)
Spot the Difference Let’s play This region has been temporarily censored Huge spikes! Are we being naïve?
Working Spike Hypothesis We’re being a little bit naïve, but nevertheless… • The mapper does not return to exactly the same place each time • Have 4 measurements of with and without the plate (i.e. 4 orientations of ) Difference taken as: w/o plate with plate
Working Spike Hypothesis We’re being a little bit naïve, but nevertheless… • The mapper does not return to exactly the same place each time • Have 4 measurements of with and without the plate (i.e. 4 orientations of ) Difference taken as: w/o plate with plate
Working Spike Hypothesis We’re being a little bit naïve, but nevertheless… +1.4377T And a careful observer will see… • This plot just shows , so the actual difference taken could be more complicated. • This theory will be clearer when we consider the survey information as well. • But consider the scales – overall small effect. m m +1.34994m
Spot the Difference (Again) Let’s play A real feature A consequence of being purposefully naïve
Spot the Difference (Again) Let’s play Field increased by shielding plate Would guess the centre of the shielding plate is here! T at mm T at mm Field decreased by shielding plate
Field linearity With no shielding plate, field should belinear with current. With shielding plate, field may benon-linear with current* but there’s no data to test this theory with ‘naïvely’ (i.e. with the exact same measurement grid)
Without the shielding plate… • (Red) 100% current in Solenoid Mode • (Black) 80% current in Solenoid Mode • Scale up 80% measurements and compare…
Without the shielding plate… • (Red) 100% current in Solenoid Mode • (Black) 80% current in Solenoid Mode • Scale up 80% measurements and compare… • Looks good at first glance!
Without the shielding plate (difference) This is the 100% measurement scaled down to a level that fits on the y-axis (for comparison with the bumps) This looks like more than just the earlier “spikes”
Without the shielding plate (difference) Everything is ‘perfect’ in the centre coil probe and mm are -out of phase. See the same story for Flip Mode
Hysteresis The obvious follow-up question is… Q: Do we achieve the same field when we approach it from below the operating current and above the operating current? No ‘naïve’ data to test this with. Important: This does not mean we won’t know, it just relies on a more in-depth analysis!
Residual field We do have data sets that allow us to naively look at the residual field Q: Does the residual field change depending on the previous operating current?
Residual Field Measurements No intermediate measurements carried out between these pairs of data • Every day of measurements began/ended (or both) with a field map at “0A” • Can compare measurements at 80/100% field and 0A. • Non-naïve measurements, not taking differences • Still using “mapper co-ordinates” • Order of measurements does matter Intermediate Flip Mode runs (not interspersed with 0A data). Shielding plate removed 15th—16th June. Colour-coded dots are meant to help those viewing later
7th—10th June: On-axis probe only Previously at 80% Sol. Mode Ran at 80% Solenoid Mode, then turned everything off and well-deserved weekend break 0A, so line should be flat – but is it?
7th—10th June: On-axis probe only Previously at 80% Sol. Mode Scaled 80% SM measurements for general shape comparison only. Not very flat – but there are welds, which will be magnetic (hence suffer residual field). Possibly correlates with mapper carriage movement?
10th—11th June: On-axis probe only Previously at 3.6% Sol. Mode Ran at 10A (3.6%) Solenoid Mode, then went home for the night The next morning, at 0A
10th—11th June: On-axis probe only Previously at 3.6% Sol. Mode 3.6% SM scaled for shape comparison only Similar to before?
10th—11th June: On-axis probe only Previously at 3.6% Sol. Mode 3.6% SM scaled for shape comparison only Similar to before? Yes!
11th—13th June: On-axis probe only Previously at 100% Sol. Mode Now it gets interesting: After the previous slide’s 0A run, ran at 100% SM. The next day took a 0A measurement…
11th—13th June: On-axis probe only Previously at 100% Sol. Mode 100% SM scaled for shape comparison only Much flatter! More obvious when compared to previous 0A measurements… (Does make mapper carriage movement argument moot)
11th—13th June: On-axis probe only Previously at 100% Sol. Mode 100% SM scaled for shape comparison only The only thing that happened between and is a 100% field run.
19th—19th June: On-axis probe only Previously at 100% Sol. Mode 80% SM (no shielding plate) scaled for shape comparison only All bar consistent here : Several Flip Mode runs, shielding plate removed, then back to 80%SM followed by 0A measurement.
7th—19th June: On-axis probe only Shielding plate differences 80% SM (w/ & w/o shielding plate) scaled for shape comparison only
Probe Jitter What kind of error bars should we be imagining on the previous plots? Look at the “flat” regions of the 0A measurements and see what variation there is in probe readout.