Download
1 / 46
500 likes | 767 Views
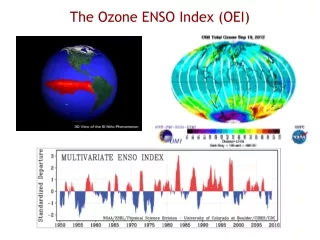
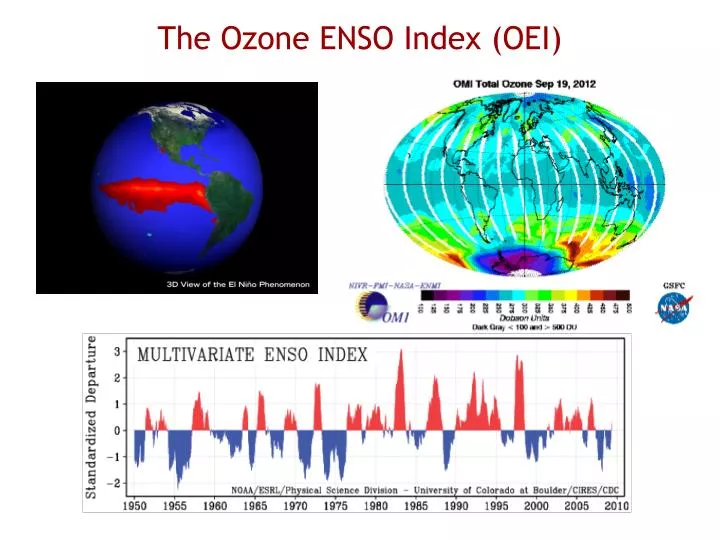
Skip Navigation (press 2) + NASA Portal + Text Only Site FIND IT @ NASA: HOME MEASUREMENTS TOOLS NEWS FAQ OMI Global Images 2012. The Ozone ENSO Index (OEI). Calendar Dates Dates in the calendar are formatted as follows: Upper #: Day of Month Lower #: Day of Year + Home

E N D
Skip Navigation (press 2) • + NASA Portal • + Text Only Site • FIND IT @ NASA: • HOME • MEASUREMENTS • TOOLS • NEWS • FAQ • OMI Global Images 2012 The Ozone ENSO Index (OEI) • Calendar Dates • Dates in the calendar are formatted as follows: • Upper #: Day of MonthLower #: Day of Year • + Home • Ozone and Air Quality • Measurements • Instruments • Multimedia • Tools • News Archive • FAQ • Documentation • Discussion • Quality Assessment • Known Issues • Ozone Hole • + Privacy Policy and Important Notices • NASA Official: Richard D. McPeters • Website Manager: Arnold Martin • Web Curator: David Larko
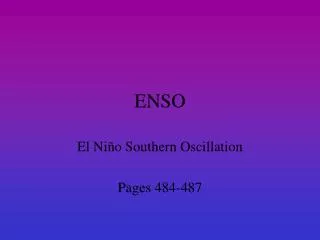
The El Nino-Southern Oscillation Quasi-periodic variation in tropical Eastern Pacific SSTs and the associated atmospheric circulation.
El Nino conditions Southern Oscillation Index: pressure difference between Tahiti and Darwin. Darwin Tahiti H L Southern Oscillation Index is negative for an El Nino
La Nina conditions L H Southern Oscillation Index is positive for an La Nina
ENSO Indices • Nino 3.4 SSTs 5 month running means of monthly SST anomalies are 0.5C or more for at least 6 consecutive months • Southern Oscillation Index Opposite sign to the Nino 3.4 SST index. Often used together with SSTs e.g. Japanese Met service Darwin Tahiti
ENSO Indices • Precipitation in the tropical Pacific • OLR anomalies • Multi-variate ENSO index uses 6 of the main observed variables over the tropical Pacific: SLP, U, V, SST, SAT, Cloud fraction.
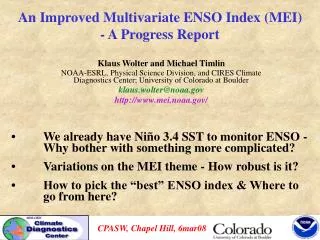
ENSO Indices Why do we need more? Motivation 1: All these ENSO indices rely on measurements of absolute fields at any point in time…instrument drift and calibration between different instruments could be a problem. Motivation 2: Devise a metric that could be used to test GCMs that are aiming to simulate variability and change in tropospheric ozone.
Climatological Ozone UV + O2O, O + O2 O3 JAN JUL http://www.knmi.nl/research/climate_chemistry/Data/FKClimatology/ NOxfrom lightening. NOx and CO from biomass burning, soil. Strat-trop exchange. Anthropogenic NOx, CO and VOC emissions
Climatological Tropospheric Ozone Climatological tropospheric ozone from OMI AURA/MLS from 2004 to 2009 http://acd-ext.gsfc.nasa.gov/Data_services/cloud_slice/#nd Wavenumber 1 structure: more ozone in the Atlantic than the Pacific. Martin et al (2001) – Atlantic enhancement primarily due to combination of lightening NOx and dynamics.
Influence of Convection on tropospheric ozone Possibilities: • Mixing of ozone poor/rich air by the convective updrafts and downdrafts • Uplift of ozone precursors into the free troposphere. • Uplift of things that destroy ozone precursors into the free troposphere.
Influence of Convection on tropospheric ozone • Lelieveld and Crutzen (1994) – Suggest that globally convection reduces tropospheric ozone concentrations by 20%. Convective updrafts transport boundary layer air into the upper troposphere where O3 production is higher and destruction is lower. But, compensating down drafts transport ozone rich air downward to the surface where it can be more effectively removed. Balance between these two effects. • Lawrence et al (2003) – Globally convection increases tropospheric ozone concentrations by 12%. Convection lifting surface NOx emissions into the upper troposphere more ozone production. • Doherty et al (2005) – Different chemistry scheme. Convection lifts isoprene reacts with NOx less NOx BUT oxidation of isoprene more HOx more O3 production. • Argument used for the wave 1 in the climatology and the ENSO changes in these papers is that convective updrafts lift low ozone air from the boundary layer up into the free troposphere • Convection Less ozone
ENSO Influence on Tropospheric Ozone Tropospheric TOC differences between October 1997 (big El Nino) and October 1996 (neutral conditions) Chandra et al (1998) Increase Decrease • Drier Indonesia more biomass burning more NOx, CO more O3 • Enhanced convection less total column ozone • Reduced convection more total column ozone
They want to look at variability in tropospheric column ozone with ENSO from total column ozone measurements. Demonstrate their method for deriving tropospheric column ozone from total column ozone works well. Demonstrating that stratospheric column ozone is quite zonally invariant. Get the tropospheric ozone out from the measurements and derive the ENSO index and show that it works. Demonstrate that actually using total column ozone also works quite well given the zonal invariance of stratospheric column ozone somewhat easier to calculate.
Satellite observations of Ozone • 1979-1993 Nimbus 7 TOMS (Total Ozone Mapping Spectrometer) Daily global coverage. Using back-scattered UV in 6 wavelength bands. • 1993-1996 SBUV/2 (Solar Backscatter Ultraviolet) Polar Orbitting, Measures vertical profiles of stratospheric ozone as well as total column ozone using a variety of UV wavelengths. • 1996-2004 Earth Probe TOMS Like TOMS but on a different satellite • 2004-2009 OMI (Ozone Monitoring Instrument) and MLS (Microwave Limb Sounder) OMI Backscattered UV and Visible. Measures more constituents than TOMS. MLS Limb sounding measurements of microwave emissions for vertical profiles
Absorption/ scattering by Earth surface and atmosphere Observation by solar backscatter • Gridded: they’ve already done all the calculation of total column ozone. Got rid of pixels where clouds are interfering etc. • Level 2 footprint measurements (nasa term). Levels describing how processed the data is. Level 2 has been processed to give you the ozone that the satellite sees. But they haven’t taken out e.g. measurements affected by clouds or put it on a uniform grid. Total ozone column and surface reflectivity is derived by measuring the backscattered light from two wavelengths, one that is strongly absorbed by ozone and one that is absorbed very little. Radiative transfer calculation based on conditions of measurement e.g. viewing angle, latitude, surface reflectance with various different total ozone columns. Figure out which one gives you the reflectance you measure. EARTH SURFACE
The Convective Cloud Differential (CCD) method Used to derive tropospheric ozone column under the assumptions….. (1) Deep convective clouds in the tropical pacific have physical cloud tops which often lie at or near the tropopause. (2) Zonal variability of stratospheric column ozone in these latitudes is small to within a few DU. Ziemke et al 1998
Testing the zonally invariance of stratospheric ozone using MLS ozone MLS provides vertical profiles of stratospheric ozonecan measure stratospheric ozone column directly. Using monthly means.
Testing the zonally invariance of stratospheric ozone using MLS ozone MLS provides vertical profiles of stratospheric ozonecan measure stratospheric ozone column directly Quite zonally invariant. At most 4DU (<2%).
Testing the zonally invariance of stratospheric ozone using MLS ozone MLS provides vertical profiles of stratospheric ozonecan measure stratospheric ozone column directly Quite zonally invariant. At most 4DU (<2%). Only small deviations from the zonal mean when you de-seasonalise.
Testing the zonally invariance of stratospheric ozone using MLS ozone Even zonally invariant using daily data. When there are sufficient numbers of deep convective clouds in the Pacific, the CCD method can be used to derive SCO and subsequently TCO on short timescales, even daily, to an accuracy of +/- 2DU.
Testing the zonally invariance of stratospheric ozone using GEOS-CCM GCM with interactive stratospheric Chemistry. Internally generated QBO.
MODEL MLS • Why? • Strong zonal winds compared to meridional winds. • Weak meridional gradients of ozone in the tropics. • Very small zonal variations in the production and destruction of ozone in the tropics.
If you use the Convective Cloud Differential method to get stratospheric column ozone over regions with high cloud you can get tropospheric column ozone at other longitudes.
MLS SCO and CCD derived SCO agree well can use CCD derived TCO measurements to obtain a long term record of TCO
Zonal dipole anomalies in tropospheric column ozone associated with El Nino and La Nina events.
Deriving the Ozone ENSO Index • Temporal cross correlations of Nino3.4 and SOI ENSO indices Averaged TCO over these areas. Use West –East, monthly
Error associated with assumption of stratospheric zonal invariance
The Ozone ENSO Index Motivation 1: All these ENSO indices rely on measurements of absolute fields at any point in time…instrument drift and calibration between different instruments could be a problem. Motivation 2: Devise a metric that could be used to test GCMs that are aiming to simulate variability and change in tropospheric ozone.
Goddard Earth Observing System (GEOS-5) GCM • Coupled to the Global GMI stratosphere-troposphere chemical mechanism (interactive chemistry in both troposphere and stratosphere). • 117 chemical species, 322 chemical reactions, 81 photolysis reactions. • Includes the O3-NOx-Hydrocarbon chemistry necessary for the simulation of tropospheric ozone. • Simulation forced with observed SSTs. (1985-2009)
Model Obs
Model Model (25y)
Looking at the vertical structure of ozone anomalies using the model Regressed the de-seasonalised ozone onto the Nino 3.4 index averaged between 15S and 15N
Comparing vertical profiles with ozonesondes The SHADOZ network.
Conclusions • A new ENSO index has been derived based on satellite measurements of total column ozone. • Because they are looking at differences between western and eastern Pacific it is self calibrating. • They used this to test whether a CCM can reproduce the observed tropospheric ozone variability it does. • Further examination of the vertical, longitudinal and latitudinal variations in the ozone response demonstrate a relationship with changes in the atmospheric circulation. • They plan to do a full budget analysis of the ozone changes in the future.
Current Conditions http://cpc.ncep.noaa.gov http://www.temis.nl/protocols/o3col/data/omi/o3doas_today.gif