Download
1 / 4
40 likes | 146 Views
9 / 22/ 11. AGENDA – Scenario 3-6. 1. How many trees were planted in the city altogether in 2005? 2. How many Palm trees were planted? 3. How many more Maple trees were planted than Pecan trees? 4. How many less Pear trees were planted than Oak trees?

E N D
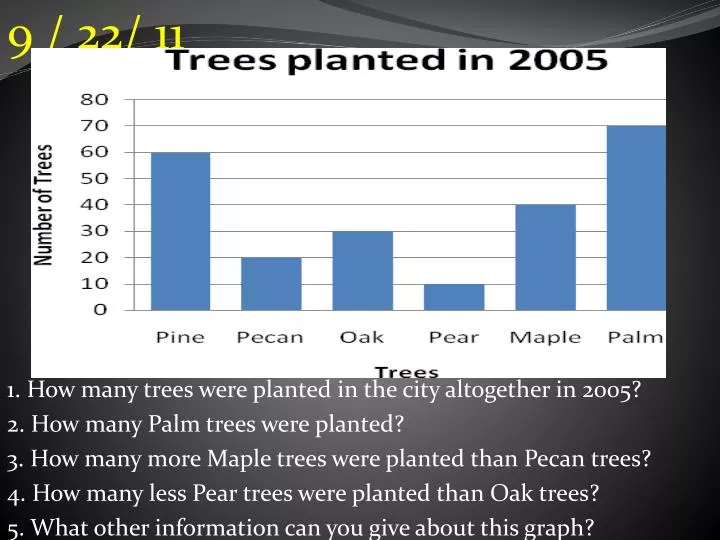
9 / 22/ 11 AGENDA –Scenario 3-6 1. How many trees were planted in the city altogether in 2005? 2. How many Palm trees were planted? 3. How many more Maple trees were planted than Pecan trees? 4. How many less Pear trees were planted than Oak trees? 5. What other information can you give about this graph?
9 / 26 / 11 Directions: The following graph shows the money spent by Paul on eating out during the weekdays AGENDA –Scenario 3-6 WRITE 5 QUESTIONS THAT CAN BE ANSWERED BY THIS GRAPH
9 / 27/ 11 AGENDA –Scenario 3-6 1. Can you tell me why car sales have fallen with the graph provided? 2. In which two months were the same number of cars sold? 3. Based on the pattern what will happen in August? 4. What is the difference between the months in which the maximum and minimum cars were sold? 5.What is the total number of cars sold in Feb. & April only?
9 / 28 / 11 AGENDA –Scenario 3-6 • Smithers thinks that a special juice will increase the productivity of workers. He creates two groups of 50 workers each and assigns each group the same task (in this case, they're supposed to staple a set of papers). Group A is given the special juice to drink while they work. Group B is not given the special juice. After an hour, Smithers counts how many stacks of papers each group has made. Group A made 1,587 stacks, Group B made 2,113 stacks. Identify the: • 1. Control Group • 2. Independent Variable • 3. Dependent Variable • 4. Controlled Variable (constant) • 5. What should Smithers' conclusion be?