Download
1 / 75
750 likes | 903 Views
Population Change in Texas: Implications for Human and Socioeconomic Resources in the 21st Century. by Steve H. Murdock Institute for Demographic and Socioeconomic Research The University of Texas at San Antonio. Major Demographic Trends Affecting the Future.

E N D
Population Change in Texas:Implications for Human and Socioeconomic Resources in the 21st Century by Steve H. Murdock Institute for Demographic and Socioeconomic Research The University of Texas at San Antonio
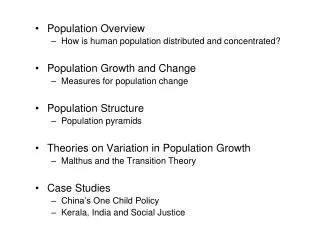
Major Demographic Trends Affecting the Future • Change in Rates and Sources of Population Growth • Increase in the Non-Anglo Population • Aging of the Population
Total Population and Percent Population Change in Texas and the United States, 1850-2005
Total Population and Components of Population Change in Texas, 1950-2005
Ten Fastest Growing States in Numerical Terms in the United States, 1990-2000
Ten Fastest Growing States in Numerical Terms in the United States, 2000-2005
Ten Fastest Growing States in Percentage Terms in the United States, 1990-2000
Ten Fastest Growing States in Percentage Terms in the United States, 2000-2005
Ten Largest States in United States by Population Size in 2000 Ranked by Population Size in 2000
Ten Largest States in United States by PopulationSize in 2000 Ranked by Population Size in 2005
Numerical Population Change by Components of Change in the United States and Selected States, 1990-2000 and 2000-2005
Percent of Population Change by Components of Change in the United States and Selected States, 1990-2000 and 2000-2005
Population Change in Texas Counties, 1990-2000 Source: Texas State Data Center
Population Change in Texas Counties, 2000-2003 Source: Texas State Data Center
Population Change in Texas Counties, 2000-2004 Source: U.S. Bureau of the Census, 2004 County Estimates
Texas Rank Among States on Selected Characteristics of Race/Ethnicity Groups
Texas Rank Among States on Selected Characteristics of Race/Ethnicity Groups
Anglo Population For States in the United States in 1990 and 2000 Ranked by Total Population Size in 2000
Texas Rank Among States on Selected Characteristics of Race/Ethnicity Groups
Numerical Change in Population by Race/Ethnicity in Texas for 1980-1990 and 1990-2000
Percent Change in Population by Race/Ethnicity for 1980-1990 and 1990-2000 in Texas
Proportion of Net Population Change Attributable to Each Race/Ethnicity Group in Texas for 1980-1990 and 1990-2000
Major Changes in Population Composition(Characteristics) • Age
Percent Change in Population by Age Group in the United States and Texas, 1990-2000
Percent of Texas Population by Age Groupand Ethnicity, 2040*
Population in Texas by Race/Ethnicity in 2000 and Projections of the Population in Texas by Race/Ethnicity from 2010 to 2040
Percent Change for Selected Time Periods for Projected Population in Texas by Racial/Ethnic Status Under Alternative Assumptions of Migration Scenarios
Percent of Population in Texas by Race/Ethnicity in 2000 and Projections of the Percent of the Population in Texas by Race/Ethnicity from 2010 to 2040
Projected Proportion of Population by Race/Ethnicity in Texas, 2000-2040*
Percent of the Projections of the Population by Race/Ethnicity and Age Groups in Texas from 2000-2040 Under Alternative Migration Scenarios
Projected Percent of Net Change Attributable to Each Race/Ethnicity Group for 2000-2040*
Percent Change from 2000 to 2040 in Selected Age Groups in the Texas Population Under the 1.0 Scenario
Median Household Income in 1999 in Texas by Age of Householder Thousands
Median Household Income In 1999 in Texas by Race/Ethnicity of Householder
Educational Attainment in 2000 in Texas for Persons 25+ Years of Age By Race/Ethnicity Percent
States Ranked by Percent High School Graduates + in the Population 25 Years of Age or Older, 2000
States Ranked by Percent High School Graduates +in the Population 25 Years of Age or Older, 2004 Source: U.S. Census Bureau. Current Population Survey (CPS), 2004 Annual Social and Economic Supplement
States Ranked by Percent College Graduates +in the Population 25 Years of Age or Older, 2000
States Ranked by Percent College Graduates +in the Population 25 Years of Age or Older, 2004 Source: U.S. Census Bureau. Current Population Survey (CPS), 2004 Annual Social and Economic Supplement