Download
1 / 1
10 likes | 124 Views
The Use of Empirically Derived Detergent Phase Boundaries to Crystallize Membrane Proteins. M. Koszelak-Rosenblum, A. Krol, N. Mozumdar, K. Wunsch, A. Ferin, E. Cook, C. Veatch, R. Nagel, J. Luft, G. DeTitta, and M. G. Malkowski . Hauptman-Woodward Medical Research Institute, Buffalo, NY, USA.

E N D
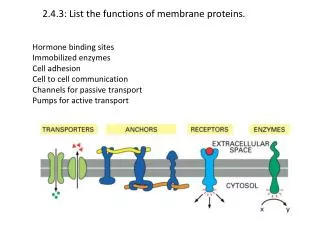
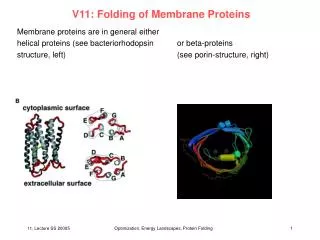
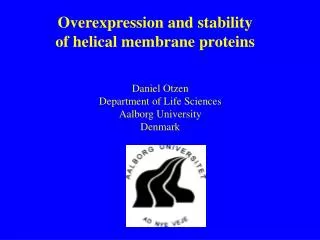
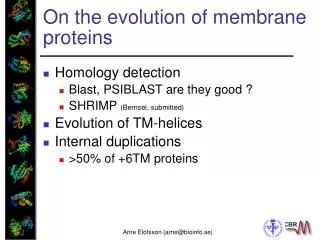
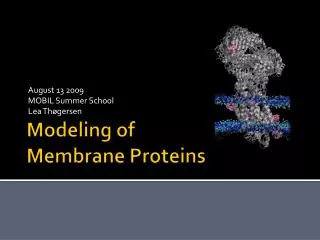
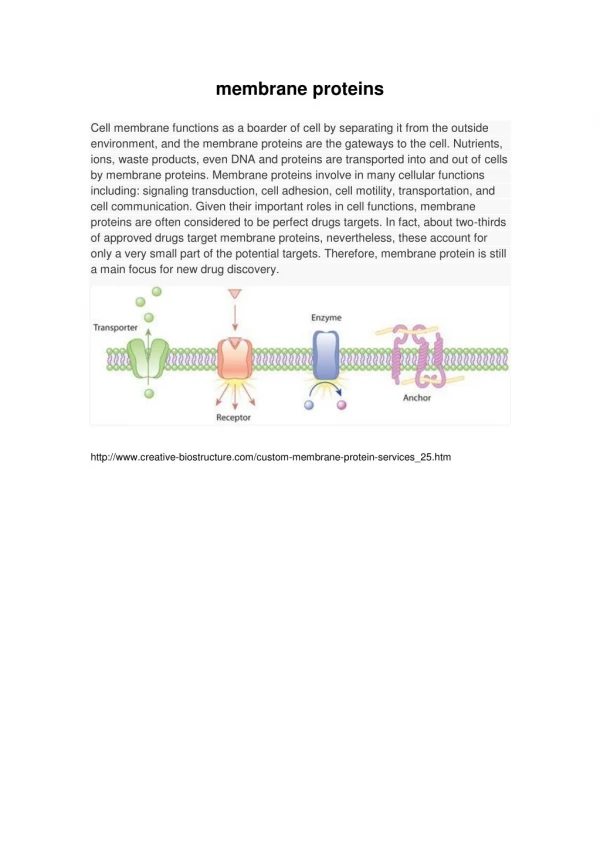
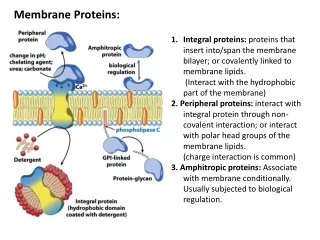
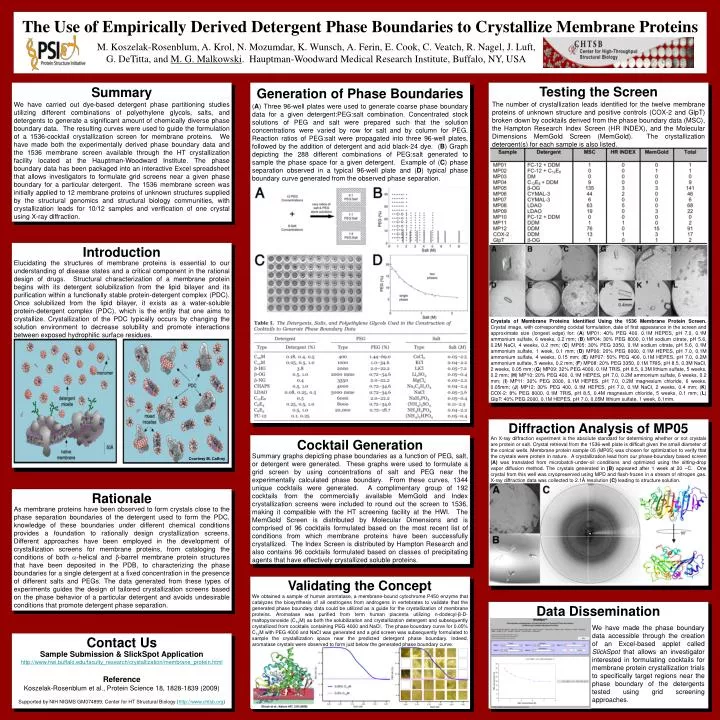
The Use of Empirically Derived Detergent Phase Boundaries to Crystallize Membrane Proteins M. Koszelak-Rosenblum, A. Krol, N. Mozumdar, K. Wunsch, A. Ferin, E. Cook, C. Veatch, R. Nagel, J. Luft, G. DeTitta, and M. G. Malkowski. Hauptman-Woodward Medical Research Institute, Buffalo, NY, USA Testing the Screen Summary We have carried out dye-based detergent phase partitioning studies utilizing different combinations of polyethylene glycols, salts, and detergents to generate a significant amount of chemically diverse phase boundary data. The resulting curves were used to guide the formulation of a 1536-cocktail crystallization screen for membrane proteins. We have made both the experimentally derived phase boundary data and the 1536 membrane screen available through the HT crystallization facility located at the Hauptman-Woodward Institute. The phase boundary data has been packaged into an interactive Excel spreadsheet that allows investigators to formulate grid screens near a given phase boundary for a particular detergent. The 1536 membrane screen was initially applied to 12 membrane proteins of unknown structures supplied by the structural genomics and structural biology communities, with crystallization leads for 10/12 samples and verification of one crystal using X-ray diffraction. Generation of Phase Boundaries The number of crystallization leads identified for the twelve membrane proteins of unknown structure and positive controls (COX-2 and GlpT) broken down by cocktails derived from the phase boundary data (MSC), the Hampton Research Index Screen (HR INDEX), and the Molecular Dimensions MemGold Screen (MemGold). The crystallization detergent(s) for each sample is also listed. (A) Three 96-well plates were used to generate coarse phase boundary data for a given detergent:PEG:salt combination. Concentrated stock solutions of PEG and salt were prepared such that the solution concentrations were varied by row for salt and by column for PEG. Reaction ratios of PEG:salt were propagated into three 96-well plates, followed by the addition of detergent and acid black-24 dye. (B) Graph depicting the 288 different combinations of PEG:salt generated to sample the phase space for a given detergent. Example of (C) phase separation observed in a typical 96-well plate and (D) typical phase boundary curve generated from the observed phase separation. Introduction Elucidating the structures of membrane proteins is essential to our understanding of disease states and a critical component in the rational design of drugs. Structural characterization of a membrane protein begins with its detergent solubilization from the lipid bilayer and its purification within a functionally stable protein-detergent complex (PDC). Once solubilized from the lipid bilayer, it exists as a water-soluble protein-detergent complex (PDC), which is the entity that one aims to crystallize. Crystallization of the PDC typically occurs by changing the solution environment to decrease solubility and promote interactions between exposed hydrophilic surface residues. Cocktail Generation Summary graphs depicting phase boundaries as a function of PEG, salt, or detergent were generated. These graphs were used to formulate a grid screen by using concentrations of salt and PEG near the experimentally calculated phase boundary. From these curves, 1344 unique cocktails were generated. A complimentary group of 192 cocktails from the commercially available MemGold and Index crystallization screens were included to round out the screen to 1536, making it compatible with the HT screening facility at the HWI. The MemGold Screen is distributed by Molecular Dimensions and is comprised of 96 cocktails formulated based on the most recent list of conditions from which membrane proteins have been successfully crystallized. The Index Screen is distributed by Hampton Research and also contains 96 cocktails formulated based on classes of precipitating agents that have effectively crystallized soluble proteins. Diffraction Analysis of MP05 An X-ray diffraction experiment is the absolute standard for determining whether or not crystals are protein or salt. Crystal retrieval from the 1536-well plate is difficult given the small diameter of the conical wells. Membrane protein sample 05 (MP05) was chosen for optimization to verify that the crystals were protein in nature. A crystallization lead from our phase-boundary based screen (A) was translated from microbatch-under-oil conditions and optimized using the sitting-drop vapor diffusion method. The crystals generated in (B) appeared after 1 week at 20 ーC. One crystal from this well was cryopreserved using MPD and flash-frozen in a stream of nitrogen gas. X-ray diffraction data was collected to 2.1Å resolution (C) leading to structure solution. Courtesy M. Caffrey Rationale As membrane proteins have been observed to form crystals close to the phase separation boundaries of the detergent used to form the PDC, knowledge of these boundaries under different chemical conditions provides a foundation to rationally design crystallization screens. Different approaches have been employed in the development of crystallization screens for membrane proteins, from cataloging the conditions of both a-helical and b-barrel membrane protein structures that have been deposited in the PDB, to characterizing the phase boundaries for a single detergent at a fixed concentration in the presence of different salts and PEGs. The data generated from these types of experiments guides the design of tailored crystallization screens based on the phase behavior of a particular detergent and avoids undesirable conditions that promote detergent phase separation. Crystals of Membrane Proteins Identified Using the 1536 Membrane Protein Screen. Crystal image, with corresponding cocktail formulation, date of first appearance in the screen and approximate size (longest edge) for: (A) MP01: 40% PEG 400, 0.1M HEPES, pH 7.0, 0.1M ammonium sulfate, 6 weeks, 0.2 mm; (B) MP04: 30% PEG 8000, 0.1M sodium citrate, pH 5.6, 0.2M NaCl, 4 weeks, 0.2 mm; (C) MP05: 30% PEG 3350, 0.1M sodium citrate, pH 5.6, 0.1M ammonium sulfate, 1 week, 0.1 mm; (D) MP06: 20% PEG 8000, 0.1M HEPES, pH 7.0, 0.1M ammonium sulfate, 4 weeks, 0.15 mm; (E) MP07: 50% PEG 400, 0.1M HEPES, pH 7.0, 0.2M ammonium sulfate, 5 weeks, 0.2 mm; (F) MP08: 20% PEG 3350, 0.1M TRIS, pH 8.5, 0.3M NaCl, 2 weeks, 0.05 mm; (G) MP09: 32% PEG 4000, 0.1M TRIS, pH 8.5, 0.3M lithium sulfate, 5 weeks, 0.2 mm; (H) MP10: 20% PEG 400, 0.1M HEPES, pH 7.0, 0.2M ammonium sulfate, 6 weeks, 0.2 mm; (I) MP11: 30% PEG 2000, 0.1M HEPES, pH 7.0, 0.2M magnesium chloride, 6 weeks, 0.05mm; (J) MP12: 30% PEG 400, 0.1M HEPES, pH 7.0, 0.1M NaCl, 2 weeks, 0.4 mm; (K) COX-2: 8% PEG 8000, 0.1M TRIS, pH 8.5, 0.4M magnesium chloride, 5 weeks, 0.1 mm; (L) GlpT: 40% PEG 2000, 0.1M HEPES, pH 7.0, 0.05M lithium sulfate, 1 week, 0.1mm. Validating the Concept We obtained a sample of human aromatase, a membrane-bound cytochrome P450 enzyme that catalyzes the biosynthesis of all oestrogens from androgens in vertebrates to validate that the generated phase boundary data could be utilized as a guide for the crystallization of membrane proteins. Aromatase was purified from term human placenta utilizing n-dodecyl-β-D-maltopyranoside (C12M) as both the solubilization and crystallization detergent and subsequently crystallized from cocktails containing PEG 4000 and NaCl. The phase boundary curve for 0.05% C12M with PEG 4000 and NaCl was generated and a grid screen was subsequently formulated to sample the crystallization space near the predicted detergent phase boundary. Indeed, aromatase crystals were observed to form just below the generated phase boundary curve. Data Dissemination We have made the phase boundary data accessible through the creation of an Excel-based applet called SlickSpot that allows an investigator interested in formulating cocktails for membrane protein crystallization trials to specifically target regions near the phase boundary of the detergents tested using grid screening approaches. Contact Us Sample Submission & SlickSpot Application http://www.hwi.buffalo.edu/faculty_research/crystallization/membrane_protein.html Reference Koszelak-Rosenblum et al., Protein Science 18, 1828-1839 (2009) Supported by NIH NIGMS GM074899; Center for HT Structural Biology (http://www.chtsb.org)