Download
1 / 64
640 likes | 878 Views
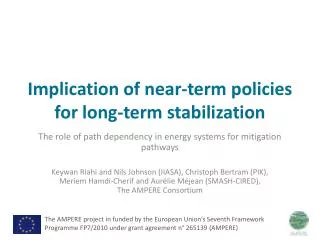
International Institute for Applied Systems Analysis (IIASA). Medium-term Mitigation for Long-term Stabilization National mitigation potentials, costs and co-benefits. Side event at the Conference of the Parties (COP10) December 8, 2004 18.00 – 20.00. IIASA’s research questions.

E N D
International Institute for Applied Systems Analysis (IIASA) Medium-term Mitigation for Long-term Stabilization National mitigation potentials, costs and co-benefits Side event at the Conference of the Parties (COP10) December 8, 2004 18.00 – 20.00
IIASA’s research questions • How do mitigation portfolios across gases and sectors vary as a function of • different stabilization levels, • socio-economic development paths, • technology availability and costs, • policy instruments, and • degree of cooperative behavior of agents? • What are, for different policy objectives, efficient sets of medium-term mitigation options • for different global long-term strategies, • for different countries, • while maximizing co-benefits with other policy areas?
Agenda • Global long-term strategies for stabilizing GHG concentrationsNebosja Nakicenovic/Markus Amann • Medium-term potentials and costs of national GHG mitigation options -Fabian Wagner • Medium-term multi-gas mitigation strategies – Ger Klaassen • Co-benefits of greenhouse gas mitigation on air pollution – Markus Amann • The impacts of ozone precursor emissions on radiative forcing and background ozone – Frank Raes (JRC Ispra)
Global long-term strategies for stabilizing greenhouse gas concentrations Nebosja NakicenovicKeywan Riahi, Shilpa Rao
Approach • IIASA’s MESSAGE energy model extended to other GHG emitting sectors (agriculture and forestry including C sinks) • Multi-gas (CO2, CH4, N2O, HFC, CF4, SF6) + black carbon • Bottom-up representation of mitigation technologies • Endogenized competition of mitigation options across all sectors • Endogenized energy feedback effects from non-CO2 mitigation (capture of CH4 in coal mines, CH4 from landfills, etc.) • Global, 11 world regions, up to 2100 • Output: Costs, main mitigation measures, uncertainties
The “fossil fuel intensive” path A2SRES assumptions • High population (12 bn) • Low per-capita income • Fossil fuel intensive development • Fragmented world • Emphasis on regional cultures, traditions, cooperation and economic development unions • Little technology transfer to developing countries • Large regional disparities • Ratio of North-South income gap 4:1 in PPP (as today) • Very little further convergence
The “sustainable development” path B1SRES assumptions • Rapid global economic development, high per-capita income • Fast economic "catch-up" of developing countries – North-South income gap reduced to less than 2:1 (PPP) • Rapid structural change of the global economy • “Dematerialization" of the economies • Reduced energy intensity • Changed life styles • Invoked by increased environmental awareness
Forestry Energy Industry & Others Agriculture Sinks Mitigation in energy Mitigation in Industry & others Mitigation in agriculture Global GHG emission pathsSRES A2 and B1”no climate measures” scenarios[Gt C/yr] A2 Fossil fuel intensive B1 Sustainabledevelopment
The “sustainable development” path B1Assumed non-climate policies (according to SRES) • Globalization with enhanced multi-lateral cooperation • Technology transfer with fast introduction of advanced technologies also in developing countries • Successful large-scale R&D programs • Targeted population policies to reduce fertility rates in developing countries • World population ~6 billion • Other “sustainable development” policies • Aggressive air pollution control • Stringent efficiency standards
Illustrative stabilization analysisfor the A2 and B1 paths Illustrative GHG stabilization target: • 4.5 W/m2 radiative forcing (2.3 degrees C) increase in 2100 compared to pre-industrial levels • To be achieved through control of all 6 Kyoto gases Provisional analysis uses 100 years GWPs
Forestry Energy Industry & others Agriculture C sinks Mitigation in energy Mitigation in Industry & others Mitigation in agriculture Global GHG emission pathsA2 and B1 stabilization cases [Gt C/yr] A2 Fossil fuel intensive B1 Sustainabledevelopment
CO2 CH4 N2O Main mitigation measuresCumulative carbon removal, 2000-2100 [Gt C] 800
Power generation Industry Residential Transport Stabilization case Co-benefits of GHG stabilizationon emissions of black carbon and organic carbon, A2 scenario [Mt] Black carbon Organic carbon Emission reductions from stabilization in:
Conclusions • Sustainable development paths achieve a significant share of stabilization effort as a co-benefit • In fossil-intensive paths stabilization efforts are very costly • Non-CO2 mitigation options reduce stabilization costs • Mitigation of non-CO2 gases make an important contribution in the near-term, but CO2 mitigation remains essential in the long-term • GHG stabilization paths lead to a significant reduction of black and organic carbon as a co-benefit
Fabian Wagner Lena Hoglund, Ger Klaassen, Antti Tohka, Wilfried Winiwarter Medium-term potentials and costsofnational greenhouse gas mitigationoptions
GAINS A new tool to analyze synergies between air pollution and GHGs • GAINS: GHG-Air pollution INteractions and Synergies • Extension of RAINS integrated assessment model for air pollution to GHGs • CO2, CH4, N2O, HFC, PFC, SF6 in addition to SO2, NOx, VOC, NH3, PM • Country-by-country, 43 regions in Europe, up to 2030
Methodology For all anthropogenic sources of GHG emissions in a country: • Identification of available mitigation options • Including structural changes (fuel switch) and add-on measures • Country-specific application potentials • Baseline activity rates: national projections • Substitution potential derived from national energy models • Quantification of societal resource costs • Excluding transfers (profits, taxes, etc.) • Data sources • GHG emission inventories consistent with UNFCCC • GHG technology cost data from reviewed literature • Activity projections: provided by national governments and EU Commission
Main mitigation options for CO2162 options considered in GAINS • Power plants • Fuels shift to natural gas and renewables • Co-generation • Carbon capture • Transport • More efficient vehicles (hybrid cars) • Alternative fuels (ethanol, gas, biodiesel, hydrogen) • Industry • End-use savings • Fuel shifts • Domestic • Insulation • Solar, biomass • Fuel shift to natural gas
National cost curves for CO2Marginal costs for national energy projections 2020 [€/t CO2]
Main mitigation options for CH4 28 options considered in GAINS • Gas sector • Reduced leakages during gas transmission and distribution • Flaring instead of venting • Waste management • Recycling/composting of biodegradable waste instead of landfill • Methane recovery from landfills • Enteric fermentation • Dietary changes for cattle coupled with livestock reductions • Manure management • Anaerobic digestion plants and stable adaptation • Coal mines • Upgraded gas recovery in coal mines • Rice paddies • Modified rice strains
National cost curves for CH4Marginal costs for national activity projections 2020 [€/t CO2-eq] Costs for additional reductions beyond current legislation
Main mitigation options for N2O 18 options considered in GAINS • Arable land and grassland • Reduced fertilizer application • Optimal timing of fertilizer application • Nitrification inhibitors • Precision farming • Less use of histosols (peat soils) • Industry • Emission controls in adipic acid and nitric acid industry • Combustion • Modified fluidized bed combustion • Health care • Reduced N2O use • Waste treatment • Optimized waste water treatment
National cost curves for N2OMarginal costs for national activity projections 2020 [€/t CO2-eq]
Main mitigation options for F-gases22 options considered in GAINS • Refrigeration (domestic, commercial, transport and industrial) • Recollection, alternative refrigerants and good practice • Mobile and stationary air conditioning • Alternative refrigerants, process modifications, good practice • HCFC22 production • Incineration • Primary aluminum production • Conversion to other processes • Semiconductor industry • Limited PFC use through alternative processes • Other sectors • SO2 cover for magnesium production • Good practice for gas insulated switchgears • Alternative propellants for foams and aerosols • End of life recollection of SF6
Conclusions • GAINS offers a tool for assessing national abatement costs and potentials for reducing the 6 Kyoto gases • Based on national projections of economic activities • More than 220 mitigation options considered • Currently implemented for 43 regions in Europe Implementation for Asia in progress • Large differences in mitigation potentials and costs across regions and gases
Medium-term multi-gas mitigation strategies Ger KlaassenMarkus Amann, Lena Höglund, Fabian Wagner, Wilfried Winiwarter
Approach • Starting point: • National projections of economic activities (energy use, agriculture, industrial production, etc.) • For groups of countries (e.g., world regions of global model, etc.) • For medium-term time horizon (e.g., 2020) • Compare implied GHG projections with regional results of global stabilization analyses • Derive GHG emission targets consistent with global analysis • Explore medium-term mitigation portfolios that meet these targets, starting from the national activity projections • Mitigation costs • Distributional aspects • Return emissions and carbon prices to global analysis
Baseline development of European GHGs 43 countries [Mt CO2-eq] Based on national projections of activity data:
A2 B1 Western Europe Central and Eastern Europe Former Soviet Union North America Latin America Pacific Asia South Asia Centrally planned Asia Pacific and Oceania Middle East Africa Europe Stabilization case GHG emissions by world region[Gt C-eq]
Illustrative example Apply GAINS to explore least-cost mitigation strategies • For the national baseline projections for 43 European regions for 2020: • Explore a further 15% cut in total GHG emissions beyond current legislation: • With CO2 measures only • Methane case: With CO2 and CH4 measures • Multi-gas case: With CO2, CH4 and N2O measures
Emission reductions and costsfor the 15% GHG cut in 2020 GHG reductions [Mt CO2-eq] Mitigation costs [billion €/year]
Mitigation portfolio: Changes in fuel consumption, CO2-only case [% of baseline]
CO2 CH4 N2O *) not yet included in GAINS Main mitigation measuresMulti-gas case, Poland and UK, 2020 [Mt CO2-eq]
Conclusions • GAINS offers a practical tool for exploring national medium-term mitigation portfolios consistent with long-term stabilization targets • Not policy-prescriptive, but to explore implications of alternative stabilization strategies on individual countries • Inclusion of non-CO2 GHGs in mitigation strategies creates economic flexibility to improve cost-effectiveness: • For a 15% reduction of European GHG emissions in 2020: • Costs drop from 0.18% of GDP for a CO2-only strategyto 0.04 % for a multi-gas approach
Co-benefits ofgreenhouse gas mitigationon air pollution Markus AmannJ. Cofala, Z. Klimont, L. Höglund, F. Wagner, W. Winiwarter
Background • Greenhouse gases and air pollutants originate from the same sources • New scientific findings on role of aerosols and ground-level ozone for radiative forcing and air pollution • Initial GAINS focus on economic synergies: Simultaneous emission reductions offer co-benefits • Explore differences between developing and industrialized countries
Approach • GAINS cost curves for GHGs combined with RAINS cost curves for air pollutants • Illustrative GAINS analysis for the GHG scenarios presented before • Starting point: National activity projections for 2020 • Case 1: CO2-only case • 15% GHG reduction with CO2 only • Implied carbon price: 90 €/t CO2
Changes in fuel consumptionfor the CO2-only case [% of baseline consumption]
Change in emissions and AQ impactsaccompanying the CO2 reduction, compared to the baseline 2020
Avoided premature deaths attributable to PM2.5 accompanying the CO2 reduction of EU-25 [cases/yr] 1000 0 -1000 -2000 -3000 -4000 Provisional GAINS calculations
Change in emissions and health impactsaccompanying the CO2 reduction, compared to the baseline 2020
Costs for the 15% CO2 reductioncompared to REF [billion €/yr]
The multi-gas case • 15% reduction in GHGs • Achieved by CO2, CH4 and N2O • Carbon price: ~40 €/t CO2
Change in emissions and health impactsaccompanying the GHG reduction, compared to the baseline 2020
Costs for the 15% multi-gas reductioncompared to REF [billion €/yr, % GDP 2020]