Download
1 / 24
240 likes | 297 Views
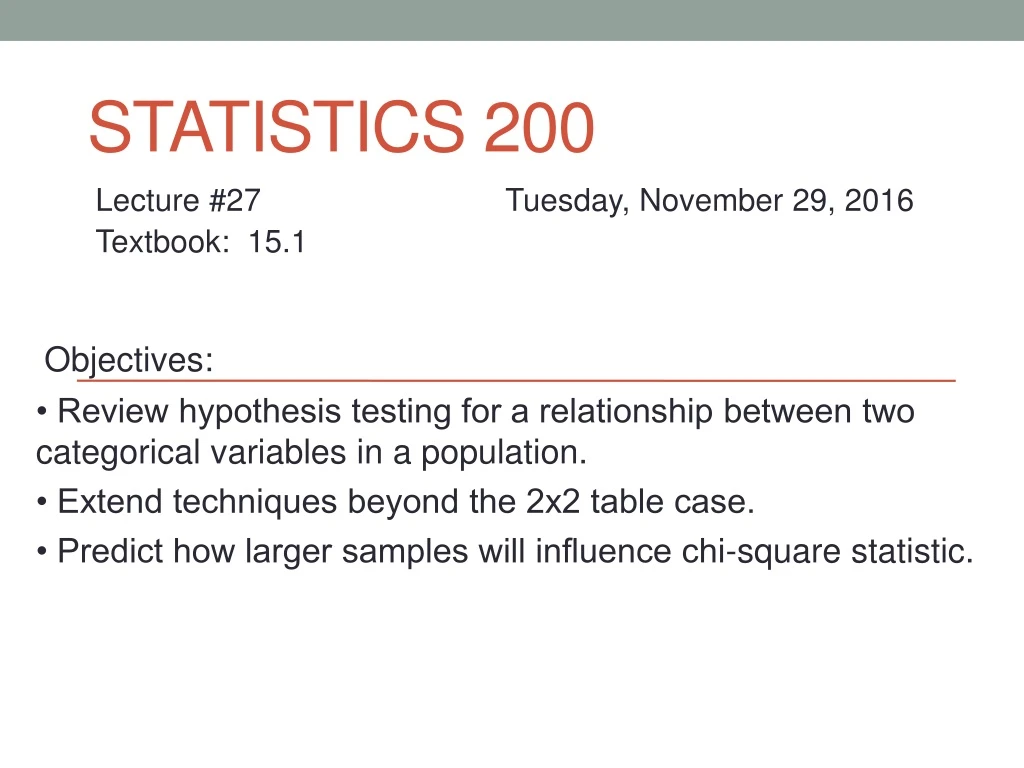
Statistics 200. Objectives:. • Review hypothesis testing for a relationship between two categorical variables in a population. • Extend techniques beyond the 2x2 table case. • Predict how larger samples will influence chi-square statistic. Lecture #27 Tuesday, November 29 , 2016

E N D
Statistics 200 Objectives: • Review hypothesis testing for a relationship between two categorical variables in a population. • Extend techniques beyond the 2x2 table case. • Predict how larger samples will influence chi-square statistic. Lecture #27 Tuesday, November 29, 2016 Textbook: 15.1
Motivating Example: Have you ever missed class because of alcohol? 1. Have you ever missed class because you were drinking the night before? We asked a random sample of PSU students the following questions: What kind of variables are these? Quantitative Categorical 2. What year are you in school? a. Freshman b. Sophomore c. Junior d. Senior
2 Way Contingency Tables Summarizing responses: Generic notation: • (explanatory)×(response) table Example: (4 × 2) table implies: • explanatory variable: ___ levels • response variable: ____ levels 4 2
Have you ever missed class because of alcohol? Which is the explanatory variable? Year in school. Missed class or not Student Response Variable: _______ answer k = _____ samples Samples are… Dependent Independent Y / N 4 4 2 ___ x ____ table
Null Hypothesis: H0 Starting Position: __________ is happening Nothing Null: With (2 way Tables): In the ______________ there is: • ____ relationship between the two variables • ____ difference in the groups population No No Statistical Hypotheses: never include statements about ________ sample null Never trying to prove the ______ is true
Alternative Hypothesis: Ha Something Challenging Position:__________ is happening data Goal: hope the _____ support the alternative Alternative: With (2 × way Tables): In the population, there is: _____ relationship between the two variables; _____ difference in the groups some some
We can state hypotheses two ways Null Hypothesis: H0: In the population, no relationship between school year and the likelihood of missing class because of alcohol. H0: p1 = p2 = p3 = p4 Alternative Hypothesis: Ha: In the population, a relationship exists between school year and the likelihood of missing class because of alcohol Ha: at least one pi differs
Do descriptive results show support for Ha? Row Percents Yes – those percents look different for the 4 groups
We quantify evidence for the alternative using… • Next step: Find chi-square statistic using sample data • This statistic measures the difference in the __________ and ___________ counts in the contingency table. • Calculate using sample data Chi-Square statistic observed expected
Expected count = 30 70 7.5 3.2 Chi-square Contribution = Get Chi-square statistic by summing contributions from all the cells
Check the necessary conditions for using a chi-square test (page 603) 30 70 Are all expected counts at least 1? Are 80% or more of the expected counts at least 5? 7.5 3.2 If the answer is yes to both, we’re safe; the sample is large enough to make the test work well.
How many df for the chi-Square statistic? The chi-square statistic follows a chi-square distribution with a specific number of degrees of freedom (df ). df = (r – 1)(c – 1) r = # row variable categories d = # column variable categories For our example, df = 1 B. 2 C. 3 D. 4
Chi-Square Results Rows: SchoolYr Columns: Missed_Class Yes No All Fr 15 85 100 30 70 7.500 3.214 So 25 75 100 30 70 0.833 0.357 Jr 30 70 100 30 70 0.000 0.000 Se 50 50 100 30 70 13.333 5.714 All 120 280 400 Cell Contents: Count Expected count Contribution to Chi-square Pearson Chi-Square = 30.952, DF = 3, P-Value = 0.000 df= (r – 1)x (c – 1)
Analysis & Conclusion H0: p1 = p2 = p3 = p4 Ha: at least one pi differs Chi-Sq = 30.952 & p-value = 0.000 Conclusions: We can claim that • a relationship exists between school year and the likelihood of having missed class because of alcohol in the population. • at least _____ population proportion of yeses _________ when comparing the four school years one differs
New Example: • Was PSU your first choice? * no * yes • How many college applications did you submit? * (1-2) * (3-5) * (6-8) * (≥ 9)
Example 2: Two Different Categorical Variables Variable 4 levels Not a binomial Identify Variables: • explanatory: PSU first choice • response: number of applications submitted This is an example of a ___ x ___ table 2 4
Row percentsfor each level of explanatory variable Descriptively: what do the row percents suggest? They suggest a difference
State Hypotheses Null Hypothesis: Ho: no relationship between PSU choice and number of college applications submitted in the population H0: distributions are _____ the same for the two PSU choices both Alternative Hypothesis: Ha: relationship exists between PSU choice and number of college applications submitted in the population Ha: distributions are ___ ____the same for two the PSU choices not both
Minitab Output:Stat > Tables > Cross tabulation & Chi-square Is there a statistically significant relationship found? ________ _________ distributions are found Rows: PSU_Choice Columns: College_Applied (1-2) (3-5) (6-8) (=>9) All No 12 60 29 19 120 33.60 56.40 21.00 9.00 Yes 100 128 41 11 280 78.40 131.60 49.00 21.00 All 112 188 70 30 400 Cell Contents: Count Expected count Pearson Chi-Square = 40.392, DF = 3, P-Value = 0.000 Yes! Different
Example 2: Two Different Categorical Variables Pearson chi-square = 40.392 Double all counts to get: Pearson chi-square = 80.784, which is exactly doubled!
Yet another pair of categorical variables: How satisfied are you with your overall appearance? •(very) •(somewhat) •(not much) What do you best like to wear when going to and from classes? •shorts • athletic wear • jeans • other Satisfaction Explanatory Variable: Response Variable: Table: __ x __ Which clothes 3 4
What does the pattern of row percents show us? Very similar? Very different? Look for significance using Chi-square statistic to decide!
Inferentially no support for a relationship in the population H0: No relationship, or no difference among the three distributions. Ha: Relationship exists, or some difference exists among the three distributions. Pearson Chi-Square = 6.34, DF = 6, P-Value = 0.386 NOT Can _____ claim that there is a statistically significant relationship or that different distributions are found We cannot rule out randomness as a plausible explanation for what has happened.
If you understand today’s lecture… 15.1, 15.3, 15.11, 15.17, 15.19, 15.47, 15.49, 15.59 Objectives: • Review hypothesis testing for a relationship between two categorical variables in a population. • Extend techniques beyond the 2x2 table case. • Predict how larger samples will influence chi-square statistic.