Download
1 / 25
250 likes | 354 Views
The Federal Budget and Tax Policy. Lecture by Robert M. Coen Emeritus Professor of Economics Northwestern University September 29, 2009. Federal Receipts and Expenditures (Billions of dollars). Quarter Receipts Expenditures Surplus 2000Q1 2,032.9 1,827.7 205.2

E N D
The Federal Budget and Tax Policy Lecture by Robert M. Coen Emeritus Professor of Economics Northwestern University September 29, 2009
Federal Receipts and Expenditures(Billions of dollars) Quarter Receipts Expenditures Surplus 2000Q1 2,032.9 1,827.7 205.2 2009Q2 2,214.7 3,509.6 -1,294.9 Change +181.8 +1,681.9 -1,500.1
Estimated Federal Budget Surplus for 2009-12(Billions of dollars per year) Jan. 2001 est. +846 Early 2000s downturn -291 Bush policies -673 (tax cuts, Iraq, drug ins.) Current recession -479 Bailouts -185 Continuing policies (e.g., war, AMT adj.) -232 Obama stimulus -145 Other Obama programs -56 Current estimate -1,215 Source: David Leonhardt, New York Times, June 10, 2009
CBO: Baseline Federal Budget Projection 2010-142010-19 Total deficit $3,988 $7,137 ($ billions) 20102014 2019 Deficit/GDP 9.6 3.2 3.4 (Percent) Debt/GDP 61.4 66.0 67.8 (Percent)
Total Public Debt as Percent of GDP, 2008 France 68 Germany 64 Japan 173 Sweden 37 UK 52 US 61 Source: CIA World Fact Book
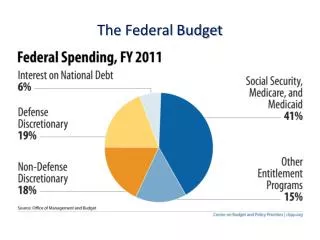
CBO: Baseline Federal Expenditures Projection Change in annual expenditures, 2009 to 2019 (billions of dollars) Total +1,294 Mandatory +506 Discretionary +243 Interest +545 Social security +418 Medicare +444 Medicaid +174
CBO: Effects of Alternative Policies on Deficit(Billions of dollars) 2010-142010-19 Baseline deficit $3,988 $7,137 30,000 troop reduction by 2013 -374 -1,074 Freeze discretionary spending -203 -950 Extend expiring tax cuts +1,640 +4,090 Index AMT for inflation +177 +448
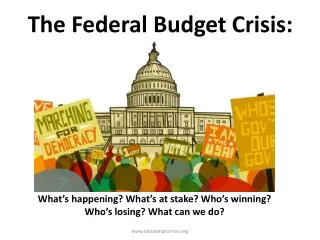
What Is Sound Budget Policy? False analogies to private debt Balance the budget? Balance current budget, borrow for capital expenditures? Balance the budget over business cycle? Keep debt/GDP ratio at “safe” level? Functional finance?
Key Comparative Ratios2006 Taxes Income tax Consumption to GDP to total tax* to GDP France 44 49 55 Germany 36 52 57 Japan 28 66 56 Sweden 49 60 46 UK 37 58 62 US 28 74 70 * Excluding property and social insurance taxes Source: OECD
How We Could Impair the Economic Well-being of Future Generations Bequeathing less capital Bequeathing a less educated, less healthy workforce Bequeathing less scientific, engineering, and managerial knowledge Bequeathing fewer natural resources Accumulating foreign debt to finance current consumption or unprofitable investment