Download
1 / 34
340 likes | 495 Views
Health Policy and the Federal Budget Process. Tim Westmoreland Visiting Professor of Law Research Professor of Public Policy Georgetown University February 2006. Figure 1. Introduction to the Federal Budget. It’s big. Really big. It drives federal policy in all areas--especially health.

E N D
Health Policy and the Federal Budget Process Tim Westmoreland Visiting Professor of Law Research Professor of Public Policy Georgetown University February 2006
Figure 1 Introduction to the Federal Budget • It’s big. Really big. • It drives federal policy in all areas--especially health. • Very few people understand even the basics. • By the time you finish this introduction, you will be one of the top 1% of Americans in terms of budget proficiency.
Figure 2 To Begin: Four Necessary Terms • Revenues--money coming into the federal government (also referred to as “receipts’) • Spending--money going out of the federal government (“outlays”) • Deficit--annual revenues minus annual spending • Debt--sum total of all annual deficits (and surpluses)
Figure 3 Total Revenues = ~$1.9 Trillion (FY 2004) • Personal Income Tax = ~$900 Billion • Social Insurance Taxes = ~$750 Billion • Corporate Taxes = ~$200 Billion • All other sources = ~$200 Billion Other Sources Corporate Taxes Personal Income Tax Social Insurance Taxes SOURCE: OMB, Fiscal Year 2004 Budget, February 2003.
Figure 4 Federal Spending in the President’s FY 2006 Budget Social Security 21% Defense Discretionary17% Medicare 13% Non-defense Discretionary19% Medicaid and SCHIP8% Other14% Net Interest8% Total Outlays= $2.57 trillion SOURCE: OMB, Fiscal Year 2006 Budget, February 2005.
Figure 5 Funding Proposed for HHS Health Programs in Bush Administration’s FY 2006 Budget HRSA11% CDC 8% Medicare 58% IHS 6% Health Discretionary Programs 9% FDA 3% NIH54% SAMHSA 6% Medicaid 33% CMS-PM 6% SCHIP 1% OS-DM6% Total = $52.6 Billion Total = $592 Billion Notes: Totals do not include funding for the Administration on Children and Families, the Administration on Aging and Program Support Center. AHRQ funding is entirely through transfers from other HHS agencies. Totals do not add to 100% due to rounding. SOURCE: HHS, Budget in Brief FY 2006, February 2005.
Figure 6 Total Deficit = Depends on How You Count It • Unified Budget (Count all revenues, including money coming in for trust funds for future use): $400 billion • On-budget Totals (Technical legal definition, not counting Social Security or the Postal Service): $570 billion • Federal Funds Budget (Count only revenues that can be spent this year): $600 billion
Figure 7 Total Debt = $8.2 Trillion and Counting… Q: What is the debt? A: Money loaned to the federal government (such as Savings Bonds or Treasury Bills) that has to be paid back with interest. Q: Where is the debt? A: ~$4.7T held by the public (investors, banks, pension funds, etc.) • Including ~$2.1T held by foreign investors and governments Plus ~$3.5T held by the federal government to use in the future (e.g., the Social Security Trust Fund, the Medicare Trust Fund, etc.)
Figure 8 Four Necessary Budget Concepts • Three kinds of spending • Baseline • Limits • Scorekeeping
Figure 9 Three Kinds of Spending • Discretionary spending • Mandatory spending • Tax spending
Figure 10 Discretionary Spending • Spending that is up to the Congress to decide each year. • In any single year, it can be from zero to 100% of the level authorized in law for each program. • The presumption is that the money will not be there unless the Congress acts to provide it. • Budgeting by dollars. • E.g., Congress may provide $100 million for childhood immunizations; how many children can be immunized for that?
Figure 11 Examples of Discretionary Spending • National Institutes of Health • Centers for Disease Control and Prevention • Indian Health Service • Title X Family Planning • Funding for • Substance Abuse and Mental Health Services Administration (SAMHSA) • Health Resources and Services Administration (HRSA) • Food and Drug Administration (FDA)
Figure 12 Mandatory Spending • Spending that is promised in statute for an ongoing period. • In any single year, it will be enough to meet the promise of the statute • The presumption is that the money will be there unless the Congress acts to change the promise in statute. • Budgeting by goods and services. • E.g., Congress may promise free vaccine to all children; how much will that cost? • Medicare and Medicaid are examples of mandatory health spending
Figure 13 Tax Spending • Tax spending is “revenue foregone,” i.e., money that would normally have come in as taxes but is, instead, kept by the taxpayer for a special use. • The usual forms are a tax deduction, a tax credit, or a refundable tax credit. • E.g., if you immunize your own child, you may be allowed to deduct the cost of the vaccine from your taxes. • Most tax spending is an ongoing promise in statute (like mandatory spending), so the presumption is that the money will be there unless Congress changes the promise in statute.
Figure 14 Tax Spending (continued) • Since the money never actually comes into the Treasury, tax spending is an indirect form of spending. • But for bookkeeping and accounting purposes, money that doesn’t come in is the same as money that comes in and goes out. • As opposed to the other spending types, this spending is rarely noted as part of the budget. • E.g., the President’s proposal for 2005 was described as “$2.57 trillion”; if tax spending had been included it would have been $3.49 trillion”.
Figure 15 The President’s Health Care-RelatedTax Proposals, FY 2006 – FY 2015 Billions of Dollars Other Health Tax Related Proposals Small Employer Tax Credit for HSA Contributions High Deductible Insurance Premiums Tax Deduction Health Insurance Tax Credit Total = $125 Billion SOURCE: Department of the Treasury, “2005 Blue Book” General Explanations of the Administration’s Fiscal Year 2006 Revenue Proposals, February 2005.
Figure 16 Figure 16 Types of Spending are Changing in Proportion 1969 2005 SOURCE: OMB, FY05 Budget, February 2005 (Historical Tables, Table 8.3).
Figure 17 Tax Spending Will Soon Outpace Discretionary Spending for the First Time SOURCE: Congressional Research Service and Federal Reserve.
Figure 18 Baseline • “The Baseline” is the projection of how much mandatory spending will be in the future. • To keep the promise in the statute, more money will be needed in the future. • E.g., the promise may cost more, may cover more people, or may include more goods and services.
Figure 19 Projections of Federal Medicare Spending, 2004-2010 Billions of Dollars SOURCE: OMB, President’s FY2006 Budget, Historical Tables, February 2005.
Figure 20 Changes to the Baseline • For instance, the promise of Medicare will cost more next year than this year. • There will be more people who qualify. • The costs of current services will inflate. • The mix of goods and services will expand (e.g., old technologies (like X-rays) will be supplemented with new ones (like CAT scans) • Providing the same amount of money from year to year would erode the promise.
Figure 21 Limits--Discretionary • Discretionary spending is limited by an overall cap, specified in the annual Congressional budget resolution. • The total of all discretionary spending cannot exceed a specified total. • This creates a zero-sum game for new spending. • Creating a new program requires cutting an existing program.
Figure 22 Limits—Mandatory and Tax Spending • Mandatory spending and tax spending already in law are not capped. • A cap would force breaking statutory promises. • Unless Congress changes the promise in statute, mandatory spending and tax spending grow automatically. • Any legislation that increases mandatory or tax spending above the level specified in the annual Congressional budget resolution is subject to a “Pay As You Go” (or PAYGO) requirement. • PAYGO requires that any legislation increasing mandatory spending promises must be accompanied by legislation reducing mandatory spending promises by an equal amount.
Figure 23 Scorekeeping • To know whether new legislation meets PAYGO requires an estimate of the costs and savings. This estimate is called “the score.” • The Congressional Budget Office (CBO), a non-partisan branch of the Congress, is the official scorekeeper of legislation.
Figure 24 Scorekeeping(continued) • CBO estimates the five-year costs of mandatory spending or tax spending legislation. • E.g., a bill to provide free immunizations to all children will increase spending • Or, put another way… costs= (number of children) x (percentage of children who will seek immunization) x (cost of the immunizations per child) x (expected increases in children, percentages, and costs).
Figure 25 Scorekeeping(continued) • In estimating the score, CBO may also take into account possible savings. • E.g., the immunizations bill may save some money because children will no longer be hospitalized for preventable illness.
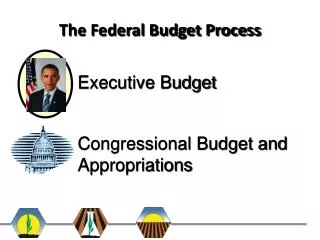
Figure 26 Federal Budget Process President’s Budget Submitted to Congress First Monday in February Congressional Budget Resolution OR Discretionary spending allocated to the Appropriations committees Budget Reconciliation - Senate Finance, House Commerce, House Ways & Means, and other committees report changes to House/Senate budget committees - Changes compiled into one bill - Bill considered by House/Senate and negotiated in conference - Bill signed by the President Annual Appropriations - House and Senate Appropriations committees sub-allocate spending to their subcommittees - Bills considered by House/Senate and negotiated in conference - Bills signed by the President Fiscal Year begins October 1 SOURCES: Congressional Budget Act of 1974, as amended; Oleszek, Congressional Procedures and the Policy Process, 2001
Figure 27 The Federal Budget Calendar:February- March Early February: President submits proposed budget for the next year to the Congress. • This budget sets the Administration’s programmatic and funding priorities • Proposal only advisory to the Congress-- not binding February & March: House and Senate committees hold hearings on the proposed budget.
Figure 28 The Federal Budget Calendar:April April 15:The Congress passes a House/ Senate Budget Resolution. • Resolution is a blueprint of Congress’ plan for the budget. • It is NOT law and is NOT sent to the President for signature. • This resolution contains both the Discretionary Spending Cap and any targets for planned cuts or increases in mandatory and tax spending. Note: This deadline is frequently missed.
Figure 29 The Federal Budget Calendar:May-September May through September: • Appropriations Committees draft and enact legislation to provide discretionary spending for the coming year, up to the level of the Discretionary Spending Cap. • Authorizing Committees draft and enact legislation to make mandatory and tax spending changes to meet targets set in the Budget Resolution. • The entire package of this legislation is called “Budget Reconciliation” (because it “reconciles” the promises in statute with the targets for the budget).
Figure 30 The Federal Budget Calendar: October October 1: New federal fiscal year begins • If appropriations laws are not enacted by October 1, Congress typically enacts temporary “band-aid” measures (called Continuing Resolutions) to keep programs operating until the laws are enacted.
Figure 31 Four (of Many) Health Policy Problems Caused by the Budget Process • Discretionary spending breaks promises. • Health care costs grow faster than discretionary spending. Programs to provide comprehensive health care (like the Indian Health Service) will fall behind. • Long-term health investments discouraged. • New prevention and treatment efforts may reduce mandatory spending in the long run, BUT scorekeeping looks at only the next five years. • E.g., early treatment of HIV costs money in the short run but may save money in the long run.
Figure 32 Four Problems(continued) • Tax spending is opaque and unevaluated. • Increasingly, federal policy is funded through tax spending, BUT it is not generally shown as part of the budget and is rarely evaluated for effectiveness. • Scorekeeping overprices and undervalues health benefits. • Scores for prevention and treatment may appear high— BUT that’s because the services keep people alive longer.
Figure 33 In Conclusion • The budget and its process are always changing. • E.g., surplus once in 2000, huge deficits since. • E.g., Medicare will soon begin paying for services out of its trust fund. • E.g., new rules for PAYGO are under consideration. • But it will always be big and it will always drive policy. • But now you understand it.


![READ [PDF] The Federal Budget: Politics, Policy, Process full](https://cdn7.slideserve.com/12598233/the-federal-budget-politics-policy-process-dt.jpg)