Download
1 / 61
620 likes | 824 Views
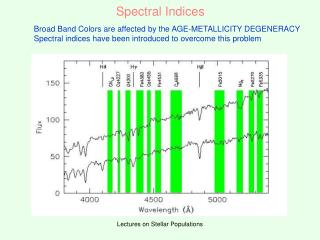
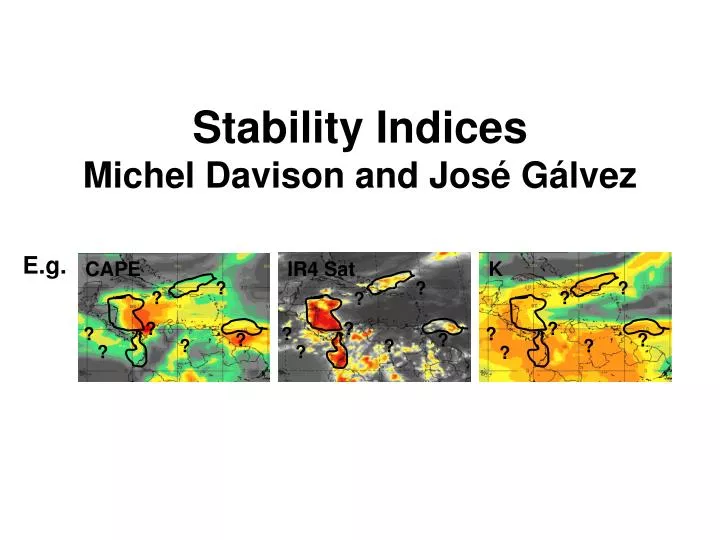
Stability Indices Michel Davison and José Gálvez. E.g. CAPE. IR4 Sat. K. ?. ?. ?. ?. ?. ?. ?. ?. ?. ?. ?. ?. ?. ?. ?. ?. ?. ?. ?. ?. ?. Why are they important ?. Stability indices can help to determine the potential for convection , its type and severity .

E N D
StabilityIndicesMichel Davisonand José Gálvez E.g. CAPE IR4 Sat K ? ? ? ? ? ? ? ? ? ? ? ? ? ? ? ? ? ? ? ? ?
Why are theyimportant? • Stabilityindices can helpto determine thepotentialforconvection, itstype and severity. • ShallowDeep 1/57
ColumnStability • Objectiveevaluation of atmosphericstabilityisone of thehardestchallengesforthe tropical forecaster. • TraditionalIndices are onlydesignedkeepingmid-latitudes in mind(theynotalwaysworkforthetropics). • Itisessentialto be abletodistinguishbetweenperiodswiththepotentialfor • Shallowconvection • Deepconvection 2/57
TraditionalIndices • ParcelMethod • LiftedIndex(LI) • ShowalterStabilityIndex (SSI) • Total Totals (TT) • K Index (K) • ThermodynamicMethod • CAPE 3/57
ParcelMethod To determine instability, a parcel of air is displaced in the vertical assumingthereis no interactionwiththeenvironment. 4/57
ParcelMethod To determine instability, a parcel of air is displaced in the vertical assumingthereis no interactionwiththeenvironment. 5/57
ParcelMethod Shallowconvectionexample(Key West, FL, 04-Mar-2013 00z) -Neutral/unstablebelow 800 hPa -Verystablefrom 800 to700 hPa (inversionor “lid”) -Stablealoft Stable (parcelneedstoomuchforcingtoeitherascendordescend) Extremelystable, subsidenceinversion (parcelwillnotascendordescend) Unstable/neutral: parcel can easilyascendordescend (convectionfavored) 6/57
LiftedIndex (LI) • LI = 500 hPaTemperature (Ambient) – 500 hPaParcelTemperature (Temperaturethattheparcelwouldhaveifascendingfromtheboundarylayer) LI = T500– TPARCEL_500 TPARCEL_500 T500 7/57
LiftedIndex (LI) • The more negativethe more unstable. • LimitingFactors: • Considersonlytwolevels. • Aplicable intobarotropic air masses in thewarmside of uppertroughs. LI = T500– TPARCEL_500 _ + NEGATIVE: UNSTABLE POSITIVE: STABLE 8/57
LI Values • Positive: Stable • 0 to -4: MarginallyUnstable • -4 to -6: Unstable • < -8: Extreme Instability 9/57
ShowalterStabilityIndex (SSI) • Similar to LI butascendingfrom 850hPa: SSI = 500 hPaTemperature (Ambient) – 500 hPaParcelTemperature, ascending from 850 hPa • Functionswellwhenthereis a coldlayerpresentunder 850 hPa. • Doesnotworkwhencoldlayerextendsover 850 hPa. • Doesnotconsidereffects of diurnalheating. • Doesnotworkifstationislocatedover 850 hPa. 10/57
SSI Values • Positive: Stable • 0 a -4: MarginallyUnstable • -4 a -6: Unstable • Lessthan -8: Inestabilidad Extrema 11/57
SSI - LI Intercomparison • Bothconsideronlytwolevels • 500 hPa • Levelwhereparceloriginates (BL top or 850 hPa) • LI >0, SSI > 0 Verystablelayer • LI < 0, SSI > 0 Unstableboundarylayer, possibleinversionaloft. • LI > 0, SSI < 0 Stableboundarylayer, butatmospheretendstobecome more unstablewithheight. • LI < 0, SSI < 0 = Deepunstablelayer 12/57
Total Totals TT = (T850 + Td850) - (2*T500) Calculatedwith 500 hPaTemperatures and bothTemperature and Dewpoint at 850 hPa. UNSTABLE (High Values) STABLE (LowValues) Lowervalueswhenmid-troposphereiswarm and lowtropospherecool and dry. Highervalueswhenmid-troposphereiscool and lowlevels are warm and moist. COOL WARM 500 500 850 850 DRY MOIST WARM COOL 13/57
Total Totals PROS • Easytocalculate. • Works wellovermid-latitudes and some times overthetropics. LIMITATIONS • Considersonlytwolevels. • Doesnotworkoverelevatedterrain (Psfc>850 hPa). • Problemswheninversions are presentbetweenthesetwolevels. • Toohighover post-frontal air masses. 14/57
K Index K = (T850 – T500) + [ Td850 – (T700-Td700) ] • Sincethe K-indexconsidersavailablewateren 850 y 700 hPa, tendstofunctionwell in thetropics. • Goodformaritime tropical air masses. • CIMH: K-indexvaluesthat favor deepconvection • NorthernCaribbean > 24 • SouthernCaribbean/South America > 30 Water vapor contentbetween 850 and 700 hPa (availablewater) Vertical temperature gradient (stability) 15/57
Valores del K(Mid-latitudes) • Once dewpoints at 850 hPa are high and Dewpointdepression at 700 islow, K-indexvalues are highindicatingthepresence of a deepwarm and moistairmass. • 15 – 25 = LowPotentialforConvection • 26 – 39 = ModeratePotentialforConvection • +40 = High PotentialforConvection 16/57
Limitingfactorsforthe K-Index • Doesnotseemid-levelinversions. • Doesnothelpto determine stormseverityonitsown. • When 850-500 temperaturedifferences are large, the K index can generatevaluesthat are toohigh and unrealistic. • Notapplicableovermountainousterrain, onlyover flat areas of lowelevations. 17/57
ThermodynamicMethod 18/57
CAPE • Representsthepotentialenergy of parcelsthatascendovertheLevel of Free Convection (LFC). • Convectivepotentialishigherwhenthe LFC islower. • Itis a goodwaytoevaluatethepotentialforsevereweather. • Units in Joules per kilogram(Energy per unitmass) • Representstheavailableenergyrequiredtoforce a parceltoascend Alsorepresentstheamount of worka parcep exertsonitsenvironment. 19/57
ConvectiveInhibitors(CINS/CINH) • Negativepart of the sonde isthe CINH: • High values of CINH implyconvectionsuppression • Toolow CINH facilitatesenergyrelease and thedevelopment of deepconvection. • CINH valuesthat are in themiddlesuggestthatconvectiondependsonthe CAPE. • Low CAPE Convectioninhibited • Large CAPE Delayedconvectionwithexplosivepotential (as a pressurecooker) 21/57
CAPE Values(in mid latitudes) CAPE ConvectivePotential 0 Stable 0-1000 MarginallyUnstable 1000-2500 ModeratelyUnstable 2500-3500 VeryUnstable 3500+ ExtremelyUnstable 22/57
CAPE LimitingFactors • CINHneedsto be considered • CINHvalues are notdirectlyproportionalto CAPE values • Tropical air massessometimesdevelophighvalues of CAPE and no deepconvectiondevelops. Example: Imagen de satélite IR4 CAPE 23/57
Sonde fromCuracao 24/57
Sonde from Curacao 25/57
Sonde from Santo Domingo 26/57
Problems in theTropics • Tropical atmospheretendstobecome more unstable AFTER (notbefore) deepconvection: -Effects of latentheatrelease and columnmoistening. • Parcelmethodworksbetteronlyifthereiscold air at mid-levels • TUTT present • Tropical troposphereisverydeep. Thistendstogenerateveryhighvalues of CAPE that are notalwaysconducivefordeepconvection. 27/57
PossibleSolution In thetropics… • Weneedtoconsiderentirecolumn • Vertical distribution of moistureisessential. • Vertical temperaturegradients are verysubtle. • Meso-synopticforcing in thetropicsistoosubtle.. • Forcingdependsmuch more onradiativeheating, associatedbreezes and orographiceffects. • Tropical convectiondependsmuch more onconvectiveinstability. • Columnthermodynamics are essential. 28/57
ColumnConvectiveInstability • Can be evaluatedusing vertical profiles of equivalentpotentialtemperature(THTE). • This combines effects of temperature and moisture. • Columnisconsideredconvectivelyunstablewhenequivalentpotentialtemperature (THTE) decreaseswithheight. Thisrepresentswarm and moist (light) air sittingundercool and dry (dense) air. • If THTE increaseswithheight, wherewarm and moist air sitsovercool and dense air, thecolumnisconvectivelystable. 29/57
EquivalentPotentialTemperatureConvectiveInstability Inversion Deepinstability 30/57
ConvectiveInstability • Calculatingit:We can calculatethealgebraicdifferencebetweentwolevels. Thiswould capture thetendency in theatmosphere and wouldallowustorapidlyfindwherethecolumnisconvectivelyunstable in a horizontal plane (map). ConvectiveInstability ~ THTE 700 – THTE 850 • Dif > 0, Stable • Dif < 0, Unstable 31/57
Differences in a vertical crosssection Honduras ITCZ 33/57
Problemswiththismethod • Doesnotconsidercolumnthickness. • Samelimitations as parcelmethod. • Doesnotdistinguishbetweenthermalcores and inversions: • Problem in thetropics: SUBSIDENCE INVERSIONS. Thedecrease of moisturewithheightoverwhelmsthetemperatureincrease. This leads to a sharpdecrease in THTE (instead of anincrease). So sharpdecrease in THTE in thetropics can be associatedalsoto extreme stability. 34/57
EquivalentPotentialTemperature Δ = -8 Δ = -21 Δ = -6 35/57
TheGalvez-DavisonIndex (GDI) forconvectiveinstability in theCaribbeanBasin José Manuel Gálvez Mike Davison 36/57
Basis Z Studies (2) Forecastingexperience: Mike Davisonnoted a clearrelationshipbetweencolumns of highθe and convection “Thermalcore” = Column of highθe = region of highmoisturecontent and heatwithrespecttotheenvironment. X What else matters in the Caribbean? -Trade wind inversion is essential! Often (not always) determines depth of convection. Aside from high stability, dry air entrainment important. -Mid-level temperatures. TUTTs can enhance convection by cooling the mid-levels and destabilizing mid-upper troposphere. Warm mid-levels near ridges enhance stability and inhibit convection. 37/57
What to do? Try to develop a new index that works in the Caribbean! Methodology • Identify key processes that lead to different types of convection across region. • Identify the signature of these processes • on model variables. • Combine relevant variables using arithmetic • expressions to come up with one number • that summarizes variable interactions. 38/57
Conceptual Model of signature of different atmospheric processes on the θe Field Trade wind inversion: stable layer and dry air entrainment Shallow convection can also produce heavy rain 39/57
Algorithm Galvez- Davison Index (GDI) Inversion Index (II) Optional Corrections (OC) Thermal Index (TI) + = + Structure enhancement Decreases GDI near the equatorial troughs, where TCF values tend to be excessive. Inversion factor (IF) Convection inhibition due to weak lapse rate between 950hPa and 700hPa, often associated with trade wind inversion. θe core factor (TCF) Summarizes vertical structure of heat and water vapor using θe at 6 levels to assess the potential for convection. (Enhancement Factor) (Inhibition Factor) Mid-level warming factor (MWF) Infers stabilizing/destabilizing effect ridges/troughs using 500hPa temperatures. Warmer mid-levels imply more stability and deep convection inhibition. Orography Decreases GDI over high terrain to reduce high values from fictitious interpolation. Mostly to improve visualization of model output. Drying factor (DF) Convection inhibition due to evaporation of clouds that penetrate dry layer aloft, also associated with trade wind inversion. (Inhibition Factor) (Inhibition Factor) 40/57
Part 1: Base calculations P(hPa) INPUT VARIABLES INPUT 500 ●T,r LAYER C 700 ●T,r LAYER B 850 ●T,r 950 ●T,r LAYER A 41/57
Part 1: Base calculations P(hPa) INPUT VARIABLES Layer averages of potential temperature and mixing ratio 500 ●T,r LAYER C 700 ●T,r 850 LAYER B ●T,r 950 ●T,r LAYER A 42/57
Part 2. Base calculations, EPT P(hPa) INPUT VARIABLES Equivalent Potential Temperature (EPT) Proxys • Uses the formula compiled by Davies-Jones(2009). • Simplification: TLCL replaced by TK850 since effect on final GDI is small. • CONSTANTS • α= -10 K (Adjustment) 500 LAYER C ●θC,rC,TK850 700 LAYER B 850 950 LAYER A ●θB,rB,TK850 ●θA,rA,TK850 43/57
Part 2: Thermal Index 44/57
Part 2: Inversion Index 45/57
Optional corrections terrain and high values near ITCZ/NET Galvez-Davison Index (GDI) Thermal Index (TI) Inversion Index (II) Optional Corrections (OC) = + + 46/57
GDI GDI vs Two-levels Two Levels Note betterresolution of the GDI over Central America, wherethedirectdifferencebetweentwolevelssuggested a higherpotentialforconvection. 48/57
IndexValidation Comparisonagainstotherindices Evaluation: • GDIcapabilitytoforecastthepotentialformoistconvectionregimes. • Comparedagainstotherindices: • -CAPE -K Index -LiftedIndex -TOTAL TOTALS • Observationsused (“true”) Averages of cloud top temperaturesfrom IR4 satellite data • Periodsweresinchronized The GDI workedbetterthanthetraditionalindices, providingbetterdetailabouttheareasforthepotential of differentconvectionregimes (shallow and deep) 49/47