Download
1 / 31
340 likes | 637 Views
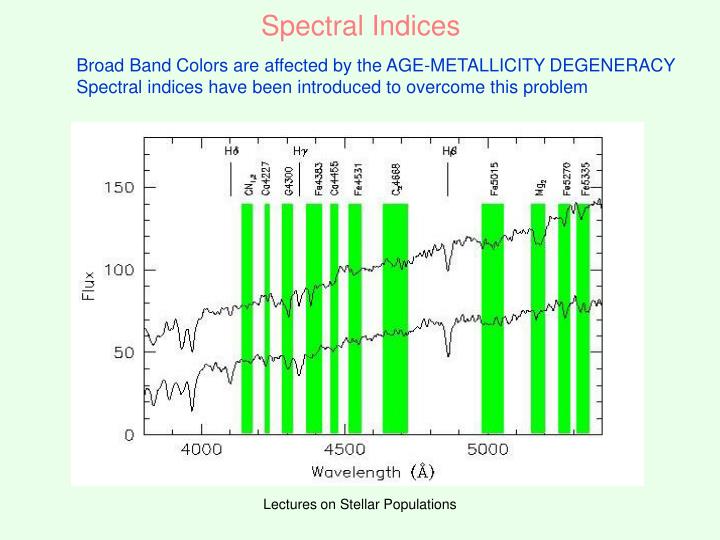
Spectral Indices. Broad Band Colors are affected by the AGE-METALLICITY DEGENERACY Spectral indices have been introduced to overcome this problem. Lick Indices. Definition: Worthey, Faber, Gonzales, Burstein 1994. EW, e.g.:. MAG, e.g.:. Measurement:. Kuntschner and Davies 1997.

E N D
Spectral Indices Broad Band Colors are affected by the AGE-METALLICITY DEGENERACY Spectral indices have been introduced to overcome this problem Lectures on Stellar Populations
Lick Indices Definition: Worthey, Faber, Gonzales, Burstein 1994 EW, e.g.: MAG, e.g.: Measurement: Kuntschner and Davies 1997 Lectures on Stellar Populations
Lick Indices: measurementNOT TRIVIAL Trager’s Thesis 1. Define Pseudocontinuum Flux in the two side bands 2. Fc(λ) is the straight line through the 2 adjacent FP Then index is: Lectures on Stellar Populations
Stellar Population Indices are Synthetizednot analyzed INDICES FOR SSPs: Start from simplyfied definitions: with some algebra you get: In the SSP, each star contributes its index weighted by the star’s contribution to the total continuum flux Lectures on Stellar Populations
SSP Indices: first derive the SED, then ‘measure’ the index Kurucz models have a resolution of 20 A Lick indices resolution is 8-10 A Need a high resolution stellar SED Vazdekis 1999 500 stars (Jones, 97) with spectral resolution of 2 A: Only in the range 3820 – 4500 A 4780 – 5460 A AND Basically all stars at solar Z Lectures on Stellar Populations
Lick Indices from SED Bertone, Buzzoni et al 2004 Models of atmospheres Lectures on Stellar Populations
Alternatively: Fitting Functions Gorgas et al. 1993 Lectures on Stellar Populations
Lick Indices Worthey et al.1994 Lectures on Stellar Populations
SSP Lick Indices:an example Metallic line strenghts increase with both AGE and Metallicity Hβ gets weaker as age increases and as Metallicity increases Use combination of metallic and Balmer line strenghts to solve the AGE-METALLICITY degeneracy Lectures on Stellar Populations
First, but very interesting, results:alpha elements overabundance in Es Worthey, Faber & Gonzales 1992: At given Fe index, the data Mg index is stronger than the model predictions Interpreted as a supersolar Mg/Fe ratio Among various possibilities: Short Formation timescales for Es Notice that: ZFe,o=1.3e-03 ZO,o = 5.8e-03 Αlpha overabundance is more an Fe underabundance Lectures on Stellar Populations
First, but very interesting, results:Age spread among Es Gonzales et al. 1992: E galaxies span a small range in metallicity and a wide range in age The most metal rich are also the OLDEST The alpha overabundance syndrome is also evident 2.5 1.6 1.3 Lectures on Stellar Populations
Indices: which diagnostic power? For magnitues consider 10-0.4(INDEX) Most of the Index growth occurs in the (upper) MS and in the (lower) RGB No wander: these are the phases which Most contribute to the continuum flux In the optical The various fitting functions appear to agree in the relevant evolutionary phases: the final values of the indices happen to agree (at least for this isochrone) Lectures on Stellar Populations
Model Lick Indices compared with GCs data Puzia et al. (2002) measure Lick Indices for 12 MW GCs, 9 in the Bulge Maraston et al. (2002) derive metallicity by comparing with 12 Gyr old SSP models Spectroscopic/Photometric metallicity is available for these clusters: COMPARE THE TWO: The metallicity derived from the Mg index is approx. OK The metallicity derived from the Fe index is systematically low Again: effect of alpha overabundance (Fe depletion) Lectures on Stellar Populations
Indices with alpha enhancement Lectures on Stellar Populations
Tripicco and Bell(1995): Stellar sample with solar Z • TB compute high resolution stellar • spectra using model atmospheres • for (g,Te) combinations along the • M67 isochrone. • Model Indices are computed for solar • Mixture and for other mixtures in which • Each element abundance is doubled • So as to measure the partial derivative. • Find that some indices trace abundance • Some do not: Fe4668 is very sensitive to • C abundance • Compare model indices to • Stellar values • b) Worthey fitting functions Lectures on Stellar Populations
TB95 DWARFS W ff GIANTS Lectures on Stellar Populations
Effect of elemental variation Tripicco and Bell 1995: compute variation of Index in response to doubling the abundance of one element, which leaves (almost) constant the total metallicity Computed for Dwarf Turn-Off star Red Giant Lectures on Stellar Populations
Indices: Correction for alpha overabundancefollowing Thomas, Maraston & Bender (2003) = 0.3 Tripicco and Bell 95 give : for D, TO and G For each class compute the corrected index with: Get SSP corrected Index as: Lectures on Stellar Populations
Thomas, Maraston and Bender 2003 12 Gyr old, Solar Metallicity SSP Models: At constant Z, when [α/Fe] increase: Mg indices get stronger Fe indices get weaker [MgFe] stays constant Lectures on Stellar Populations
Thomas, Maraston and Bender 2003comparison to GC data: From model Mgb and Fe52 get Fe and αs abundance Total Z Brodie and Huchra 1990: metallicity Calibration of MW and M31 GCs Data: Puzia et al GCs Lectures on Stellar Populations
What have we learnt • In an SSP each stellar index is weighted with the contribution of the Star to the Total Continuum Flux of the SSP Cool Dwarfs have a high Mg index, but cannot be efficiently used to enhance the SSP Mg index • Metallic Line Strenghts are stronger in older and more metal rich stellar populations • Balmer Line Strenghts are stronger in younger and more metal poor stellar populations • Index – Index Diagrams offer a diagnostic for age AND metallicity • Element Abundance Ratios affect the indices in different ways The Optimist’s View: One Balmer Index One Mg Index One Fe Index AGE METALLICITY α/Fe RATIO Lectures on Stellar Populations
But: Tantalo and Chiosi (2004) SSP Models with α enhancement Based on Salasnich et al. α enhanced models + TB 95 response functions Based on patching literature isochrones + TB 95 response functions Based on isochrones + FCT + TB 95 response functions Ages depend on abundance pattern As a consequence, Z also does Lectures on Stellar Populations
Seek better diagnostic for AGE: other Balmer Indices (Hγ, Hδ) unaffected by gas emission Worthey and Ottaviani 1997 Models: high sensitivity to AGE (but Hβ is still the more sensitive) Jump from [Fe/H]=-1 to -0.5 due to Variation of HB morphology For each index 2 definitions: F for wide (40 A), A for narrow (20 A) central bandapasses Lectures on Stellar Populations
New Generation of Models:Thomas,Maraston and Korn 2004 Korn et al. (2005) compute response functions of atmospheres with various (g,Teff) for a wide range of metallicities (1/200 to 3.5 solar). Based on these, TMK re-compute Indices with variable [alpha/Fe] ratios. Contrary to Hβ (?!) higher order Balmer Indices are sensitive to [α/Fe] ratio (at high Z) The pseudocontinua contain Fe lines Lectures on Stellar Populations
Effect on Galaxies AGE Dating When [α/Fe]=0.2 is used the Ages indicated by Hβ and HγF become consistent When using solar ratio models high order Balmer lines lead to underestimate the age Lectures on Stellar Populations
New Response Functions:Korn,Maraston,Thomas 2005 Model atmospheres with high resolution for typical MS,TO and RG stars on Isochrones with Z=-2.25 …+0.67 Determine the response function of 21 Lick indices Lectures on Stellar Populations
Korn,Maraston,Thomas 2005 Solid: new response functions Dotted : old response functions Black Dots: GCs data Open Square: Bulge field Grey dots: Es The new models are almost the same As the old. We have much more confidence on the metallicity dependence of the correction for non solar [α/Fe] ratio Still not explored the behaviour along the Isochrone Lectures on Stellar Populations
Puzia et al. 2006: AGES, METALLICITIES and ABUNDANCE RATIOsof a sample of extragalactic GCs Quality of the index as age indicator depends on: Mean error of the data Transformation accuracy to the Lick system Error on the original Lick spectra Accuracy of the Lick FF Dynamic range of the index Degeneracy parameter Use: [MgFe]’ as total Z indicator Weighted ave of Balmer Lines as AGE indicator <Fe> and <Mg2> to measure [α/Fe] Notice that many GCs fall out of the Grid. This should be further investigated Lectures on Stellar Populations
CAVEATS: BALMER LINE STRENGTHSdepend on HB morphology Maraston 2003 Hβ depends on HB morphology: Models have 10 and 15 Gyr Solid: no mass loss Lectures on Stellar Populations
CAVEATS: BALMER LINE STRENGTHSdepend on HB morphology from Puzia et al 2006: OBSERVED BALMER INDICES OF MW GCs (squares) M31 GCs (inv. Triangles) LMC GCs (triangles) STAR: high Z GCs with blue HB HBR=(B-R)/(B+V+R) Lectures on Stellar Populations
CAVEATS: SPURIOUS CORRELATIONS From Thomas et al. 2005: (SFH of Ellipticals) Monte carlo Simulation: - take indices of one SSP with t=10.7, [Z/H]=0.26,[α/Fe]=0.25 - apply observed errors (gaussian) on the diagnostic indices - derive (t,Z,α/Fe) Error of the procedure can be Quantified into 0.1 dex for metallicity 0.03 for abundance ratio 1.5 Gyr of age ERRORS ON Hβ INDUCE A SPURIOUS ANTICORRELATION OF AGE AND METALLICITY Lectures on Stellar Populations