Download
1 / 10
320 likes | 995 Views
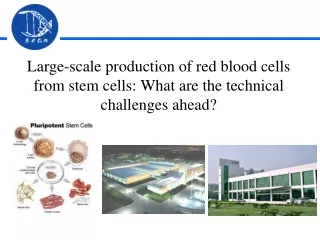
Intracellular Cytokine Staining (ICS) Flow Cytometry Assay. Kent J. Weinhold , Duke CFAR Director November 6th, 2013 CFAR Director’s Meeting Flow Cytometry Workshop. 6 h. ICS Assay Overview. 5. 4. 3. 2. 1. 6. 7. Thaw. Stimulate. Lyse/Fix. Perm. Analysis. Surface Stain.

E N D
Intracellular Cytokine Staining (ICS)Flow Cytometry Assay Kent J. Weinhold, Duke CFAR Director November 6th, 2013 CFAR Director’s Meeting Flow Cytometry Workshop
6 h ICS Assay Overview 5. 4. 3. 2. 1. 6. 7. Thaw Stimulate Lyse/Fix Perm Analysis Surface Stain IC Stain Acquisition Brefeldin Monensin TNFα Alexa700 6 hrs Rest Wash Wash Wash Wash CD107 cytokine lymphocyte erythrocyte IFN-γ PE-Cy7
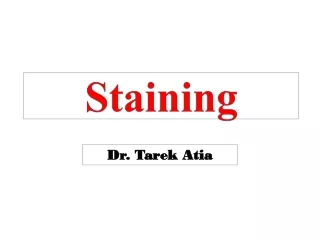
Keys to success • Instrument Qualification • Optimize PMT voltages for each type of assay (Perfetto et. a. Nat Pro 1:1522-30, 2006) • Appropriate use of controls • Unstimulated cells – negative control for stimulation • Endogenous responses may be present • FMO’s – negative control for fluorescence • Number of events acquired • Minimum of 120,000 viable CD3+ lymphocytes (Jaimes et. al. JIM 363:143-57, 2011) • Analysis • Up to 50% of assay variability (Maecker et. al. BMC Immunology 6:13, 2005and McNeil, et. al. Cytometry 83A:728-38, 2013) • Reproducibility dependent upon Operator expertise • Operator training highly recommended • Panel design (McLaughlin et. al. Cytometry73A:400-10, 2008) • Goal – appropriately classify events as positive or negative • Minimize spillover/spreading error • Bright fluorophores conjugated to dim markers • Careful use of tandem dyes • Intracellular stain: CD3, CD8, and CD4 • Requires mAb’s made against fixed antigens • Kinetics of functional markers must overlap • Use appropriate protein transport inhibitor • CD4 responses require antigen processing • Reagent Qualification • Titer all reagents using specific measures of performance (Murdoch et. al. Cytometry 81A:281-3, 2012) • Signal-to-noise (SN): positive median/negative median) • Staining index (SI): positive median/negative standard deviation • Negative median • Negative CV • Measure spillover • Bridge reagent lots – especially tandem dyes
Bridging Study Shows Degradation of Tandem Dye IFNg PE-Cy7 SS 0.15µg/mL PE-Cy7 breaking down into PE & Cy7 Testing Date: 06May11 Lot #: 02587 Expiration Date: 31Oct12 Green E (PE) IFNg PE-Cy7 SS 0.144µg/mL Testing Date: 17Feb10 Lot #: 44563 Expiration Date: 31Mar11 Green A: IFNg PE-Cy7 Green E (PE) Green A: IFNg PE-Cy7
Compensation errors create false positive CD4 CEF response SA EOLm 37.4 0.448 30.8 CD8 IL-2+IFNg CD8 IL-2+IFNg 0.0237 62.2 61.9 CD4 CD3 CD4 CD3 Compensation error & false positive CD4 CEF response Compensation corrected & No false positive CD4 CEF response
Excluding dim CD8+ cells significantly reduces CD8 response to CEF EOLm SA CD8 CD4 SA: Site Analysis; EOLm: Centralized Manual reanalysis
CD3 vs. cytokine in final plot can help visualize missing CD3 dim+ SA EOLm SA: Site Analysis; EOLm: Centralized Manual reanalysis
Duke CFAR approaches to improve assay performance • Training • Wet workshops • One-on-one intensive week-long training course offered by Duke CFAR • Collaboration between Duke CFAR Immunology & Biostatistics and Bioinformatics Cores • FlowPET • Automated analysis
Expert Gating Manual Cluster Gating Automated 0.18% 0.21% CD4 FITC IFN- + IL-2 PE 1.65% 1.9% CD8 PerCP-Cy5.5 Automated gating tools can improve signal Duke University Medical Center
Acknowledgements • Duke CFAR Biostatistics and Bioinformatics Core • Cliburn Chan, Duke CFAR Core Director • Scott White • Duke CFAR Immunology Core – Flow Cytometry • Kent Weinold, Duke CFAR Director • Jennifer Enzor • Twan Weaver • Jianling Shi • EQAPOL • Tom Denny