Download
1 / 22
220 likes | 307 Views
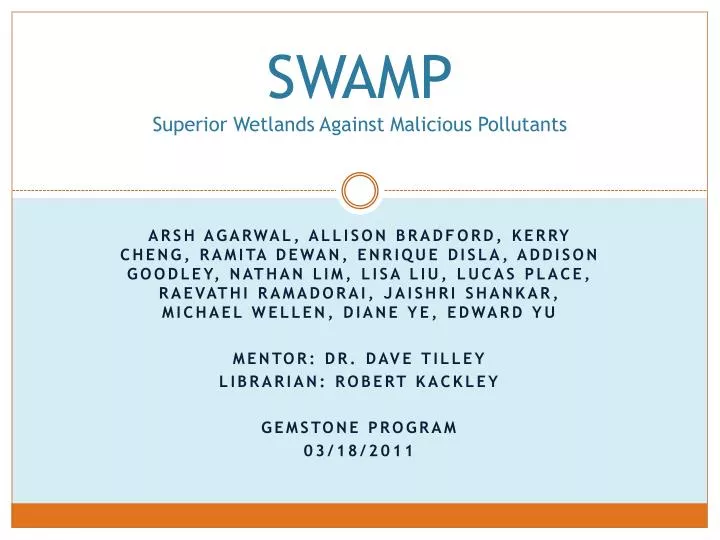
SWAMP Superior Wetlands Against Malicious Pollutants. Arsh agarwal , alliSON bradford , kerry cheng , Ramita dewan , enrique disla , addison goodley , nathan lim , lisa liu , lucas place, raevathi ramadorai , jaishri shankar , michael wellen , diane ye, edWARD yu

E N D
SWAMPSuperior Wetlands Against Malicious Pollutants Arshagarwal, alliSONbradford, kerrycheng, Ramitadewan, enriquedisla, addisongoodley, nathanlim, lisaliu, lucas place, raevathiramadorai, jaishrishankar, michaelwellen, diane ye, edWARDyu Mentor: Dr. davetilley Librarian: robertkackley Gemstone Program 03/18/2011
Research Problem • Agricultural runoff, especially in the spring, leads to high nitrate levels in the Chesapeake Bay Watershed • Causes harmful algal blooms • Result: Dead zones due to depletion of oxygen and nutrients vital to aquatic wildlife • Dead zone: low oxygen area of water
Research Problem – Significance of Project Affects fishing industry, seafood consumers, environmental groups, residents of the Chesapeake Bay Watershed Health of the Chesapeake Bay is vital for maintaining biodiversity
Overview of Project • Goal: to build a wetland that optimally removes nitrates from the Chesapeake Bay and its surrounding waters • How? With a constructed wetland! • Mostly greenhouse-based experiment in 3 phases • Emulate conditions of the Tuckahoe Creek within the greenhouse • Questions to answer through literature: • Where does the agricultural runoff come from? • What plants can we use to remove the nitrates? • Can we affect the rate of nitrate removal? How? With what?
Literature Review – Agricultural Runoff • One of the largest sources of pollution into the Bay • Main sources: fertilizer and manure • Plants only absorb up to 18% of nitrogen from fertilizer • Up to 35% of nitrogen fertilizer washes into coastal waters and their surrounding bodies of water • Nitrates come mostly from chicken manure in agricultural runoff • Eutrophication causes harmful algal blooms • Eutrophication: steep increase in nutrient concentration in neighboring bodies of water • Algal blooms lead to dead zones • Constructed wetlands • Can remove up to 80% of inflowing nitrates
Literature Review – River Selection • Big picture: Chesapeake Bay • Not ideal for accessibility, too large a body of water for us to study in such a short time • Choptank River – largest eastern tributary of the Bay • 70% of nitrogen input is from agricultural runoff • Still not very accessible for a large group of students with limited funds and transportation • Tuckahoe Creek • Tuckahoe sub-basin represents 34% of Choptank Watershed • More accessible for our team
The Nitrogen Cycle Image from: www.fao.org
Literature Review – Plant Selection • Criteria for plant selection • Non-invasive • Native to the Chesapeake Bay Watershed • Biofuel-capable
Literature Review – Plant Selection • Cattail (Typhalatifolia) • Very commonly researched wetland plant • Especially viable as a biofuel • Soft-stem Bulrush (Schoenoplectusvalidus) • More effective at denitrification than other comparable plant species. • Study: Schoenoplectus is responsible for 90% of all nitrate removal in experimental treatments • Switchgrass (Panicumvirgatum) • One of the most common, effective nitrate-removing plants in the Chesapeake Bay area
Literature Review – Biofuels • Why biofuels? • To accommodate changing energy and environmental needs • Secondary data analysis • Cattail • Potential ethanol source • Can be harvested for cellulose • Switchgrass • One hectare plot of switchgrass yielded up to 21.0 dry megagrams of biomass • Soft-stem bulrush • In one study, out of 20 wetland species, soft-stem bulrush ranked second in energy output per unit mass • Cross-referenced list of Chesapeake Bay native, non-invasive plants with list of biofuel-capable plants • Selected plants seemed to be the best options for research
Literature Review – Organic Factors • Why? • Increase statistical significance of differences in nitrate removal • Three carbon-based factors • Glucose • Increases nitrate removal rates in artificial wetlands • Sawdust • Study compared glucose & sawdust glucose ranked first, sawdust ranked second • Wheat straw • Increases nitrate removal rate for 7 days, then decreases in effectiveness
Methodology – Experimental Design & Setup • Take several samples at Tuckahoe Creek • Mostly in spring highest nitrate concentration • Use highest value of collected samples in greenhouse environment • Samples include water and soil • Soil samples are necessary to inoculate the greenhouse soil • Inoculating soil will allow Tuckahoe-native bacteria to grow in our greenhouse environment • Extraneous variables? • Realistically, we cannot emulate all elements of the Tuckahoe Creek in the greenhouse. • Nitrate concentration, soil composition, & temperature are three elements that we can realistically control
Methodology – Experimental Design & Setup (Phase 1) • Goal: find most effective organic factor • Use single plant species (cattail) • In each microcosm, place one or a combination of organic factors • Each microcosm will contain potting soil, top soil, soil from the Tuckahoe Creek (for inoculation), and the experimental variable • Inoculating greenhouse soil with Tuckahoe soil will allow Tuckahoe-native bacteria to grow in our greenhouse environment • Collect effluent from each microcosm and pour it back over the microcosmonce a day for 7 days • Measure nitrate concentration of the effluent at the end of the week. • Determine which factor or combination of factors per experimental unit most effectively increases nitrate uptake • Experimental unit is one bucket
Methodology – Example Diagram of Setup for Phase 1 Note: Phase 2 will look similar, but with different combinations in each bucket – the combinations will be of different plants, same organic factor
Methodology – Experimental Design & Setup (Phase 2) • Goal: find most effective plant or combination of plants using the organic factor determined in phase 1 • Use multiple plant species • Place each combination in a microcosm • Each microcosm will contain potting soil, top soil, soil from the Tuckahoe Creek (for inoculation), and the experimental variable • Collect effluent from each microcosm and pour back over the microcosm once a day for 7 days • Standard water analysis will determine water quality • Determine which plant or plants (experimental unit) most effectively removes nitrates from water • Experimental unit is one bucket
Methodology – Experimental Design & Setup (Phase 3) • Goal: apply the results of Phases 1 & 2 to a larger, more wetland-like setting • Use the best factor and best combinations of plants • Place them in a larger setting (i.e. a mini constructed wetland within the greenhouse) • Run experiment for 7 days, flowing water through this larger-scale wetland environment • Measure effluent once a day for 7 days to determine nitrate removal efficiency • Pending results of 1&2 depends on time
Methodology – Data Collection • Data Collection • Effluent collected every day for 7 day trial • Standard water analysis • Includes our variables, plus other details about water quality • Mostly within greenhouse • Some data collection in the field (Tuckahoe) for samples and testing of environment • Six 1-week long trials • 7 replicates of each microcosm per trial • Total of 42 data points (can assume normal distribution)
Methodology - Data Analysis • Data Analysis • Phase 1: Two-factor ANOVA • 2 levels • 4 treatments • Phase 2: Single factor ANOVA, Tukey’sStudentized Range • 1 level • 8 treatments • Statistical Analysis Software (SAS) to perform calculations
Current Progress • Finishing experimental setup and design • Ironing out the fine details of water collection/measurement/etc • Applying for grants • Bill James, ACCIAC, Library (submitted), Sea Grant, HHMI • Ongoing literature review • Tuckahoe Creek visits • Soil samples: early March • Water samples: late April/early May • This is when nitrate concentration is highest • Greenhouse space • Guaranteed space in the UMD greenhouse until May 2012
References • Anderson, D., & Glibert, P., & Burkholder J. (2002). Harmful algal blooms and eutrophication: Nutrient sources, composition, and consequences. Coastal and Estuarine Research Federation, 24(4), 704-726. • Burgin, A., Groffman, P., & Lewis, D. (2010). Factors regulating denitrification in a riparian wetland. Soil Sci. Soc. Am. J., 74(5), 1826-1833. doi: 10.2136/sssaj2009.0463 • Fraser, L. H., Carty, S. M., & Steer, D. (2004). A test of four plant species to reduce total nitrogen and total phosphorus from soil leachate in subsurface wetland microcosms. Bioresource Technology, 94(2), 185-192. • Hien, T. (2010). Influence of different substrates in wetland soils on denitrification. Water, Air, and Soil Pollution, June 2010, 1-12. doi:10.1007/s11270-010-0498-6 • Gray, K. & Serivedhin, T. (2006). Factors affecting denitrification rates in experimental wetlands: Field and laboratory studies. Ecological Engineering, 26, 167-181. • Ines, M., Soares, M., & Abeliovich, A. (1998). Wheat straw as substrate for water denitrification. Water Research. 32(12), 3790-3794. • Karrh, R., Romano, W., Raves-Golden, R., Tango, P., Garrison, S., Michael, B., Karrh, L. (2007). Maryland tributary strategy Choptank River basin summary report for 1985-2005 Data. Annapolis, MD: Maryland Department of Natural Resources. • Rogers, K., Breen, P., & Chick, A. (1991). Nitrogen removal in experimental wetland treatment systems: Evidence for the role of aquatic plants. Research Journal of the Water Pollution Control Federation, 63(7), 9. • Staver, L. W., Staver, K. W., & Stevenson, J. C. (1996). Nutrient inputs to the Choptank river estuary: Implications for watershed management. Estuaries, 19(2), 342-358. • Wright, L., & Turhollow, A. (2010). Switchgrass selection as a “model” bioenergy crop: A history of the process. Biomass and Bioenergy, 34(6), 851-868. doi:10.1016/j.biombioe.2010.01.030 • Zedler, J. B. (2003). Wetlands at your service: reducing impacts of agriculture at the watershed scale. Frontiers in Ecology and the Environment, 1(2), 65-72. • Zhang, B., Shahbazi, A., Wang, L., Diallo, O., & Whitmore, A. (2010). Hot-water pretreatment of cattails for extraction of cellulose. Journal of Industrial Microbiology & Biotechnology, 1-6. doi: 10.1007/s10295-010-0847-x
Thank you! • Many thanks to... • Dr. Dave Tilley • Dr. Bruce James • Brandon Winfrey • Dr. Wallace • Dr. Thomas • Courtenay Barrett • Gemstone Program & Staff • Robert Kackley