Download
1 / 45
450 likes | 458 Views
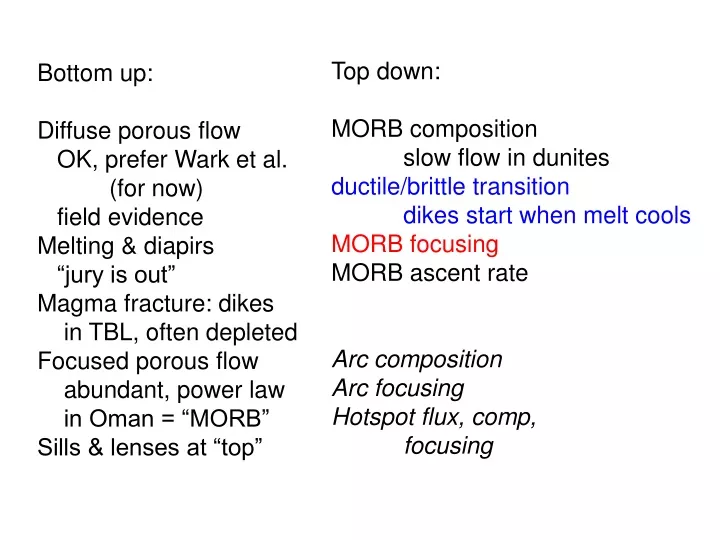
Top down: MORB composition slow flow in dunites ductile/brittle transition dikes start when melt cools MORB focusing MORB ascent rate Arc composition Arc focusing Hotspot flux, comp, focusing. Bottom up: Diffuse porous flow OK, prefer Wark et al. (for now) field evidence

E N D
Top down: MORB composition slow flow in dunites ductile/brittle transition dikes start when melt cools MORB focusing MORB ascent rate Arc composition Arc focusing Hotspot flux, comp, focusing Bottom up: Diffuse porous flow OK, prefer Wark et al. (for now) field evidence Melting & diapirs “jury is out” Magma fracture: dikes in TBL, often depleted Focused porous flow abundant, power law in Oman = “MORB” Sills & lenses at “top”
focusing to spreading ridges: five micron pores over 200 km wide region at depth feed 2 km wide zone forming entire crust Top right, Vera et al., JGR 1989, reflection image showing shallow “axial magma chamber” (AMC) and crust-mantle boundary (M). The igneous rust reaches >95% of its future thickness within a few km of the spreading ridge, despite the fact that the melting region extends for 100’s of km laterally on either side of the ridge, and melt forms in tiny pores throughout that region. Also, very simple geochemical arguments suggest that little of the melt that forms is lost. Consider a 1D column in the mantle, with decompression melting. The average amount of decompression in this column is half the total height. Most melt production is above the “dry” solidus (H2O free) at about 70 km depth. There is about 1% melting per kilobar of decompression (Ahern & Turcotte, EPSL 1979; vindicated by subsequent work). The total amount of decompression is about 20 kb, so the mean amount is 10 kb, or 10% melting. 10% of 70 km yields 7 km of crust, which is the observed amount. 10% melting of primitive or slightly depleted mantle peridotite also yields rare earth element concentrations in the melt that are consistent with observation. Thus, geochemists tend to think that most of the melt that forms in the melting region is efficiently extracted to form the crust. Thus, very efficiently, some large fraction of the total amount of melt that forms in the ~ 200 km wide melting region is transported to the ridge axis where it forms 100% igneous crust, 7 km thick, within a region less than ~ 2 km wide. How does this work? (right hand, lower figure from Wark & Watson, JGR 2003, more detailed caption in part 1).
A list of possible mechanisms for melt focusing to an oceanic spreading ridge. • Two things apparently don’t work: • Tensional cracks plus passive, plate driven mantle upwelling and spreading does not focus melt transport in a sufficiently narrow region. • B. Focused upwelling of solid, in a region that is very narrow, plus any sort of melt extraction, could work but Spiegelman, EPSL 1996 argued that such narrowly focused upwelling produces melt compositions very different from MORB. • Various other mechanisms might work, but all have their drawbacks. • C. Diffuse porous flow + “suction” of melt toward the ridge due to low pressure where plate spreading leads to tension (Spiegelman & McKenzie, Nature 1987; Phipps Morgan GRL 1987); however, this requires very high viscosity in the melting region, ~ 1021 Pa s; suction could be enhanced if anisotropic permeability favored diagonal flow toward the ridge axis (Phipps Morgan, GRL 1987; Daines & Kohlstedt, JGR 1997; Zimmerman et al, GRL 1999; Holtzman et al., G-cubed 2003; Katz et al., Nature 2006) but there is no quantitative demonstration of this effect to date. Also, diffuse porous flow can’t explain the relatively high pressure of primitive MORB/mantle equilibration. D. Coalescing dissolution channels (Kelemen et al., Nature 1995, JGR 1995, G-cubed 2000); so far, coalescence in models is insufficient (coalescence angles < 20°) to explain melt focusing to ridges (required coalescence ~ 45°); in addition, coalescence to one single channel beneath a ridge segment would probably not allow for the observed extent of isotopic heterogeneity in MORB. E. Dissolution channels up to and within a permeability barrier at the base of the conductive plate. The idea of a permeability barrier created by crystallization of melt in pore space was suggested by Sparks & Parmentier (EPSL, 1991), and modeled in more detail by Spiegelman (Phil Trans Roy Soc London 1993), Ghods & Arkani Hamed (GJI, 2000) and Rabinowicz & Ceuleneer (EPSL 2006). The permeability barrier would form a kind of “tent” focusing flow of remaining melt diagonally upward beneath isotherms to the ridge axis. Channels - “tent poles extending up along the roof of the tent” - are needed to preserve disequilibrium between primitive MORB and shallow, residual mantle peridotite. This may be the best explanation, but note high intersection angles are predicted between “tent roof channels” and off-axis “tent pole channels”, whereas few if any high angle intersections are observed between dunites in the mantle section of the Oman ophiolite. F. Combinations of coalescing channels + suction + anisotropic permeability may be the best explanation for all observations, but there is no published, quantitative model of such combinations.
Figure from Nicolas, in Ryan, ed., Magma Transport & Storage, 1990, summarizing calculations of Sleep (JGR 1984) on dike (sigma 1) trajectories in a the mantle undergoing viscous corner flow driven by plate spreading. Dikes will deliver melt to the base of the plate over a region more than 40 km wide, and thus cannot explain observations.
A second figure from Nicolas, in Ryan, ed., 1990, illustrating predicted dike (sigma 1) trajectories in the diapiric, buoyancy driven upwelling model of Rabinowicz et al. (EPSL 1984). Nicolas proposed that melt remains within horizontal dikes or lenses up to depths of around 20 km, after which rotation of the stress field gives rise to vertical dikes that carry melt to the surface. Taking this hypothesis at face value, note that melts at depths less than 20 km would be very different from MORB, because they would be relatively SiO2-rich, equilibrated with residual mantle peridotite at less than 7 kb, whereas primitive MORB is relatively SiO2 poor, equilibrated with peridotite at more than 15 kb. Very highly focused solid upwelling of this type, together with almost any melt extraction mechanism, could explain highly focused formation of igneous crust at spreading ridges. However, note that Spiegelman (EPSL 1986) showed that very highly focused upwelling gives rise to melts that are very highly depleted in incompatible elements, recording higher extents of melting than primitive MORB.
reminder of Spiegelman, EPSL 1996, model results. MORB resembles the passive, pooled melt composition and is very different from the active, pooled composition. See lecture 1 for more discussion.
Diffuse porous flow + “suction” of melt toward the ridge due to low pressure where plate spreading leads to tension (Spiegelman & McKenzie, Nature 1987; Phipps Morgan GRL 1987); however, this requires very high viscosity in the melting region, ~ 1021 Pa s; suction could be enhanced if anisotropic permeability favored diagonal flow toward the ridge axis (Phipps Morgan, GRL 1987; Daines & Kohlstedt, JGR 1997; Zimmerman et al, GRL 1999; Holtzman et al., G-cubed 2003; Katz et al., Nature 2006) but there is no quantitative demonstration of this effect to date. Also, diffuse porous flow can’t explain the relatively high pressure of primitive MORB/mantle equilibration. This figure is modified from Spiegelman & McKenzie, Nature 1987. Dashed lines = solid flow trajectories; solid lines with arrows, melt flow trajectories. Large arrows, plate spreading directions.
Phipps Morgan GRL 1987, with an identical result to Spiegelman & McKenzie Nature 1987! Melt flow lines are dashed. Solid flow lines are solid. In the right panel, dikes along sigma 1 trajectories for passive mantle upwelling, as predicted by Sleep, JGR 1984, are shown with long dashes. The value M refers to scaled mantle viscosity. Where the viscosity is high, melt focusing via suction is effective. Where viscosity is “low” (~ 1019 Pa s), melt suction (and dikes) is ineffective at focusing melt transport in the mantle to the ridge axis.
To remind you, primitive MORB records melt-mantle equilubration at 15 kb or more, so is not consistent with focusing of diffuse porous flow through shallow mantle peridotite. Channels are also required.
Phipps Morgan, GRL 1987, proposed that anisotropic permeability could help focus porous flow of melt in the mantle toward a spreading ridge. Specifically, in the diagram on the lower right (strain ellipses and sigma 1 trajectories), he suggested that deformation of olivine, plus anisotropic “wetting” of some olivine grain edges in preference to others, and/or anisotropic melt distribution due to stress, could help focus porous flow toward a ridge. Anisotropic melt distributionin mantle peridotite at high stress (and high shear strains) has been experimentally demonstrated by Kohlstedt and co-workers (Daines & Kohlstedt, JGR 1997; Zimmerman et al., GRL 1999; Holtzman et al., G-cubed 2003) and numerically predicted by Katz et al., Nature 2006. However, it is not yet clear if this anisotropy is sufficient to focus melt transport toward a spreading ridge.
Figures from Holtzman et al., G-cubed 2003 (top panel) and Katz et al., Nature 2006 (bottom three panels) illustrating agreement between experimental and numerical model results, producing high porosity bands at about 20° to the shear plane at high strain in mantle peridotite.
Figure from Katz et al., Nature 2006, illustrating approximate application of shear band concept to mid-ocean ridge mantle spreading geometry. Left panel shows stress trajectories and viscosity (non-Newtonian, temperature and stress dependent); right panel shows strain rate and predicted shear band orientation, at an angle to the principle and minimum compressive stress as in the experiments and numerical models illustrated in the previous slide. Melt bands lmay align so that they point diagonally upward toward the spreading ridge. However, as before, note that there are no calculations indicating whether the resulting anisotropy in permeability, due to the bands, would be sufficient to focus melt flow toward the ridge. Also, it has not been demonstrated that shear bands can be produced at the low stresses, strain rates, and total strains predicted in the mantle beneath a spreading ridge.
Repeating this figure from earlier in the lecture, showing coalescing dissolution channel network. In this simple model, with a static solid, the angle of coalescence of the channel network is only ~ 17°, not the ~ 45° necessary to explain focused melt flow toward a spreading ridge.
Unpublished modeling results from Spiegelman (see E and F at http://www.ldeo.columbia.edu/~mspieg/ReactiveFlow/ ) showing combination of “suction” and dissolution channels. These are preliminary, low resolution models. “Corrosive channels” panel illustrates concentration of the soluble solid phase (“pyroxene”), showing how depleted channels (“dunites”) are advected off axis by corner flow of the solid peridotite.
More unpublished modeling results combining suction due to corner flow and formation of dissolution channels, from Spiegelman (http://www.ldeo.columbia.edu/~mspieg/ReactiveFlow/). White arrows show melt flow vectors. Log(cf/cfo) tracks the concentration of an incompatible element, which is high in the channels and low in the inter-channel regions.
Note again that the concept of a permeabiliy barrier at the base of the conductive plate of Sparks & Parmentier (EPSL, 1991), modeled in more detail by Spiegelman (Phil Trans Roy Soc London 1993), Ghods & Arkani Hamed (GJI, 2000) and Rabinowicz & Ceuleneer (EPSL 2006). The simplest version of this model does not account for observations, because it would require shallow, porous flow of all the primitive MORB through all the residual peridotites, leading to low pressure equilibrium between primitive MORB and shallow mantle peridotites. This is inconsistent with both MORB (low SiO2, high pressure melt compositions) and shallow, residual peridotite (very depleted incompatible element concentrations, as shown for rare earth elements in lecture 1, Johnson et al., JGR 2000). Dissolution channels up to and within the permeability barrier could provide an effective combination consistent with most observations. The permeability barrier forms a kind of “tent” focusing flow of remaining melt diagonally upward beneath isotherms to the ridge axis. Channels - “tent poles extending up along the roof of the tent” - are needed to preserve disequilibrium between primitive MORB and shallow, residual mantle peridotite. This may be the best explanation, but note high intersection angles are predicted between “tent roof channels” and off-axis “tent pole channels”, whereas few if any high angle intersections are observed between dunites in the mantle section of the Oman ophiolite. Figures from Spiegelman, Phil Trans Roy Soc London 1993 and Braun & Kelemen, G-cubed 2002.
reminder of high crystallization rates predicted for primitive MORB entering the base of the conductive plate. Depending on the geotherm (dT/dz and dT/dx), crystallization rates could be sufficient to create a permeability barrier, as discussed earlier in this lecture. Figure from Kelemen & Aharonov, AGU Monograph 1998.
Reaction between cooling melt and peridotite enhances the crystallization rate, making it even more probable that melt could form a permeability barrier. At temperatures above plagioclase saturation for a primitive MORB composition, reaction between olivine-saturated melt dissolves pyroxene, increasing melt mass. Below plagioclase saturation, reaction between crystallizing melt and peridotite leads to increased crystallization of pyroxene, in part via reactions consuming olivine. Figure from Kelemen & Aharonov, AGU Monograph 1998.
Model results of the reactive infiltration instability in three dimensions, from Aharonov et al., JGR 1997. Panel (a) shows results for a model in which a solvent migrated upward along a solubility gradient through a partially soluble block. Porosity contours around cylindrical dissolution channels are shown. In the model illustrated in panel (b), Einat Aharonov switched the polarity of the melt-solid reaction, so that in order to maintain solid-liquid equilibrium the melt had to precipitate additional solid material rather than dissolving solid material. As a starting geometry, she used the well developed cylindrical channels shown in (a). As you can see, the channels are destroyed in the crystallization model.
Another figure from Aharonov et al., JGR 1997, showing the “correlation length” in the model results from the previous slide. Such a figure shows the probability that the porosity at another position will have a value similar to that in a given starting position, as a function of distance - in this case, vertical distance. In the highly organized channel network in panel (a) of the previous slide, there is a high probability that model positions immediately above and below a given point will have a similar porosity, high in the channels, and low in the inter-channel regions. This organized network is illustrated using the black ellipses. The “random” structure used as a starting model for the dissolution model that produced channels is shown as a solid line. Given the limitations of the model, this is as close to a truly random, white noise structure, as Einat could obtain. The results of the crystallization model, starting from the highly organized channel network, are shown as crosses. It is striking that the crystallization run returns the model domain to a completely random porosity distribution. This arises because regions with locally high permeability and porosity receive more melt flux and thus more crystallization. It is striking that the processes of channel formation and destruction are so symmetrical. We show this result here in support of the idea that crystallization in pore space can indeed create an effective permeability barrier. Additional figures in Aharonov et al., JGR 1997, show how pressure will begin to rise beneath such a barrier.
Is a permeability barrier effective enough to guide transport of most of the melt to beneath the ridge axis? This depends on the permeability contrast developed across the barrier (does enough crystallization take place in a short enough vertical interval to really drop the permeability), and on the slope of isotherms causing the onset of crystallization.
Spiegelman (Phil Trans Roy Soc London 1993) showed that the rate of crystallization at the base of the conductive plate controlled the effectiveness of the resulting permeability barrier. Slow crystallization over a compaction length (lower right) does not form an effective barrier, and all melt rises into the thermal boundary where it crystallizes in its entirety. Rapid crystallization over a short vertical interval (upper left) creates a barrier that is sufficient to force melt diagonally upward. However, note that melt flow vectors (large arrows) are not parallel to the base of the conductive plate, so that melt is lost by crystallization in the thermal boundary layer.
50 km/Myr Ghods & Arkani Hamed (GJI 2000) quantified the melt distribution in a model similar to that of Spiegelman (1993, previous slide). This paper is criticized by some because of relatively low model resolution, but contains the only quantitative evaluation of the efficiency of the permeability barrier in guiding melt to a spreading ridge.
Similar, recent calculations by Rabinowicz & Ceuleneer (EPSL 2006) reiterating the point of Spiegelman (1993) that the effectiveness of a permeability barrier depends on the rate of crystallization in a short vertical interval.
Another figure from Ghods & Arkani Hamed (GJI 2000). Total melt production is shown in red. 100% efficiency would produce more than 11 km of crust using the parameters they adopt. Total crustal production - melt focused to the ridge - is shown in purple. In these models, too much melt is lost to the thermal boundary layer (“total freezing” in blue), so little crust is produced at half spreading rates up to 50 mm/year. These results are inconsistent with the observation that oceanic crustal thickness is approximately constant and independent of spreading rate from Atlantic (half rate ~ 10 mm/year) through Pacific (more than 50 mm/year) rates. Resolving this inconsistency is the primary challenge in further development of the permeability barrier hypothesis.
In addition, as noted previously, the permeability barrier hypothesis requires diagonal channels immediately beneath the permeability barrier, fed by channels from deeper in the melting region, in order to preserve melt/mantle equilibration pressures of 15 kb or more. This figure from Sohn & Sims, Geology 2005, illustrates such a network. However, since some of the steep channels must rise vertically through transposed, horizontally foliated mantle peridotite well off axis, this hypothesis predicts (a) many dunites highly discordant to peridotite foliation, and (b) high angle intersections between steep and sub-horizontal channels. These relationships are not observed in “simple” ophiolites whose melt transport features are formed primarily at an oceanic spreading ridge, such as the Oman ophiolite. (Polygenetic ophiolites, such as the Josephine and Trinity peridotites, where off-axis and/or arc magmatism has played an important role, do show steep dunites cutting sub-horizontal peridotite foliation and high angle intersections between dunites).
A list of possible mechanisms for melt focusing to an oceanic spreading ridge. • Two things apparently don’t work: • Tensional cracks plus passive, plate driven mantle upwelling and spreading does not focus melt transport in a sufficiently narrow region. B. Focused upwelling of solid, in a region that is very narrow, plus any sort of melt extraction, could work but Spiegelman, EPSL 1996 argued that such narrowly focused upwelling produces melt compositions very different from MORB. • Various other mechanisms might work, but all have their drawbacks. • C. Diffuse porous flow + “suction” of melt toward the ridge due to low pressure where plate spreading leads to tension (Spiegelman & McKenzie, Nature 1987; Phipps Morgan GRL 1987); however, this requires very high viscosity in the melting region, ~ 1021 Pa s; suction could be enhanced if anisotropic permeability favored diagonal flow toward the ridge axis (Phipps Morgan, GRL 1987; Daines & Kohlstedt, JGR 1997; Zimmerman et al, GRL 1999; Holtzman et al., G-cubed 2003; Katz et al., Nature 2006) but there is no quantitative demonstration of this effect to date. Also, diffuse porous flow can’t explain the relatively high pressure of primitive MORB/mantle equilibration. D. Coalescing dissolution channels (Kelemen et al., Nature 1995, JGR 1995, G-cubed 2000); so far, coalescence in models is insufficient (coalescence angles < 20°) to explain melt focusing to ridges (required coalescence ~ 45°); in addition, coalescence to one single channel beneath a ridge segment would probably not allow for the observed extent of isotopic heterogeneity in MORB. E. Dissolution channels up to and within a permeability barrier at the base of the conductive plate. The idea of a permeability barrier created by crystallization of melt in pore space was suggested by Sparks & Parmentier (EPSL, 1991), and modeled in more detail by Spiegelman (Phil Trans Roy Soc London 1993), Ghods & Arkani Hamed (GJI, 2000) and Rabinowicz & Ceuleneer (EPSL 2006). The permeability barrier would form a kind of “tent” focusing flow of remaining melt diagonally upward beneath isotherms to the ridge axis. Channels - “tent poles extending up along the roof of the tent” - are needed to preserve disequilibrium between primitive MORB and shallow, residual mantle peridotite. This may be the best explanation, but note high intersection angles are predicted between “tent roof channels” and off-axis “tent pole channels”, whereas few if any high angle intersections are observed between dunites in the mantle section of the Oman ophiolite. F. Combinations of coalescing channels + suction + anisotropic permeability may be the best explanation for all observations, but there is no published, quantitative model of such combinations.
To summarize this section on melt focusing to oceanic spreading ridges, many different processes may help to focus melt flow. All, or almost all, involve porous flow rather than flow in fractures. None of the processes proposed so far appear to be sufficient in themselves, but combinations of several processes together may be sufficient to account for the observations which are (a) highly efficient focusing of almost all melt from the ~ 200 km wide melting region to the ~ 2 km wide region where igneous crust crystallizes beneath a ridge and (b) primitive MORB/mantle equilibration at 15 kb or more.
Top down: MORB composition slow flow in dunites ductile/brittle transition dikes start when melt cools MORB focusing several porous processes MORB ascent rate Arc composition Arc focusing Hotspot flux, comp, focusing Bottom up: Diffuse porous flow OK, prefer Wark et al. (for now) field evidence Melting & diapirs “jury is out” Magma fracture: dikes in TBL, often depleted Focused porous flow abundant, power law in Oman = “MORB” Sills & lenses at “top”
This series of lectures has focused on porous mechanisms of melt transport in the melting region beneath mid-ocean ridges, and by analogy in many other mantle melting regimes (though not arcs!). One criticism of such purely porous mechanisms which is sometimes offered is that melt velocity constraints from Uranium series, radioactive disequilibrium are too rapid to be met via porous mechanisms. This lecture is no place for an exhaustive explanation of U-series disequilibrium in igneous processes, but suffice it to say that they require geochemical separation of radioactive parent from radioactive daughter within the radioactive decay time scale. Parent-daughter pairs that will be used here are 238U to 230Th (230Th half life ~ 75,000 years) and 230Th to 226Ra (226Ra half life ~ 1600 years). Decay of 235U to produce 231Protactinium (Pa) adds little to the discussion of MORB transport, and is omitted here.
k ~ f3d2/270 For porous flow of melt produced by 1D mantle upwelling, as outlined in the first lecture, we have two velocity constraints: Darcy’s law, and the 1D mass balance equations of Spiegelman & Kenyon (EPSL 1992). As noted previously, following Kelemen et al., Phil Trans Roy Soc London 1997, I’ve added the volume fraction of channels in the melt transport region, , to the 1D mass balance equation. In this lecture, we will use the permeability expressio from Wark et al. (JGR 2003) and Liang et al. (JGR 2002). w is melt velocity, k is permeability, is porosity, is melt viscosity, dP/dz is the pressure gradient driving melt flow (= g for buoyancy driven flow of melt), W is the solid upwelling velocity, F is the melt fraction produced at some height in the melting column, d is the average solid grain diameter.
Schematic diagram showing how the volume fraction of channels affects the calculated melt velocity via the mass balance equation of Spiegelman & Kenyon (EPSL, 1992) as modified by Kelemen et al., Phil Trans Roy Soc London, 1997. Because the melt produced at any given depth now flows through a volume much smaller than the source volume, the melt porosity within channels is much larger than it would be if diffuse porous flow through the entire volume.
Figure from Kelemen et al., Phil Trans Roy Soc London 1997, showing melt velocity versus melt porosity. Solid black lines are solutions to Darcy’s Law, at several different solid grain sizes. Solid grey lines are solutions to the mass balance equations, at several different volume fractions of channels. of 100% indicates no channels at all. Simultaneous solutions to the mass balance and Darcy constraints are intersection points. For the of 100% solutions, at small grain sizes, velocities can be less than 1 meter/year, and thus potentially would not satisfy the constraint from 230Th/238U excesses observed in many MORB. However, larger grain sizes, or reasonable estimates of channel fraction, yield velocities that are more than sufficient to preserve 230Th excess from the base of the melting region to the seafloor. See lecture 1 for simultaneous solution of both mass balance and Darcy constraints to give velocity versus depth given grain size, solid upwelling velocity, and melting rate in %/km.
McKenzie (Chem Geol 2000) extended his interpretation of 230Th/238U excess to 226Ra/230Th excess in MORB. In fractional melting, all of the Ra and Th would be in the melt after the first tiny increments of melting, and so in this context 226Ra excess can form only on the solidus as the upwelling mantle first begins to melt, when a tiny amount of parent 230Th still remains in the residual solid phases. In this hypothesis, the initial 230Th/238U and 226Ra/230Th excesses should be positively correlated (lower righthand diagrams in this slide), with the lowest degree melts having the largest initial excesses. Because the half life of 226Ra is almost two orders of magnitude smaller than that for 230Th, this initial positive correlation would gradually decrease in slope until it became horizontal, with the remaining 230Th excess having almost its initial maximum value, but no remaining 226Ra excess.
* * *: dredge, not “0 age” MORB data summary from Sims et al., GCA 2002 for MORB from the East Pacific Rise (EPR), the Siqueros Fracture Zone along the EPR, and the Juan de Fuca Ridge (JDF) show a negative correlaton between 230Th/238U and 226Ra/230Th excesses, as noted by Kelemen et al., Phil Trans Roy Soc London 1997 based on the Juan de Fuca data alone. Note that crosses, for Atlantic samples, are dredge samples that could have undergone substantial 226Ra decay after eruption.
Jull et al., GCA 2002, modeled the negative correlation of 230Th/238U and 226Ra/230Th excesses via a two porosity system, in which 230Th/238U excesses are created near the base of the melting region and then are transported rapidly to the surface in high porosity channels, while 226Ra/230Th excesses arise via slow, reactive porous flow in the regions between channels. Lundstrom (PEPI, 2000) presented a quantitatively similar model, though again with the added hypothesis that 230Th/238U and 226Ra/230Th excesses arise at different depths via melting of deep veins and shallow, depleted peridotite. Recently, Stracke et al.(EPSL 2006 presented a model in which dramatically different upwelling rates in different parts of a triangular melting region beneath ridges could, in principle, also yield a negative correlation between 230Th/238U and 226Ra/230Th excesses, even with fractional melting. However, it is not apparent (a) how melt transport from these different regions is modeled, nor (b) what combination of parameters would produce such a large variation in mantle upwelling velocity along the base of the melting region. In fact, the non-Newtonian, temperature dependent ridge model of Katz et al., Nature 2006, shows no marked variation in upwelling velocity across the bottom of the melting region.
A more elaborate two porosity model devolves from the numerical models of reactive porous flow of Spiegelman et al. JGR 2001. Here, in figures from Spiegelman & Kelemen, G-cubed 2003, we show data on trace eleent variability of MORB. The top left diagram illustrates the range of variability of rare earth element concentrations in glass inclusions from olivine phenocrysts in just three dredge samples from the Mid-Atlantic Ridge. The lower right diagram illustrates variability in dredged glasses from the 9-10°N region along the East Pacific Rise. In both data sets, highly incompatible elements show more than two orders of magnitude of compositional variation from geographically restricted sample areas.
Spiegelman & Kelemen, G-cubed 2003, showed that a reactive model with high porosity dissolution channels (right, top six panels = porosity as a function of width and height at top, bottom panel = chemical variation in liquids passing through the top of the model domain) produced large variation in incompatible element concentrations in melts passing through the top of the model, whereas equilibrium porous flow (trace element exchange, but no dissolution channels) produced a single liquid composition at the top, which is identical to a batch, equilibrium melt of the source composition (left side).
The magnitude of chemical variation passing through the top of the model domain depends on details of the bulk viscosity at low melt fractions, which controls the porosity in the interchannel regions. These three figures from Spiegelman & Kelemen, G-cubed 2003, illustrate this point. An intermediate value of inter-channel porosity fits the MORB data best.
Finally, Spiegelman & Kelemen, G-cubed 2003, showed that the residual compositions at the top of the model domain are very similar to the observed, highly iight REE depleted compositions of residual peridotites in the Oman ophiolite and dredged from the mid-ocean ridges. Thus, we showed that the large chemical variations observed in both MORB and residual peridotites from spreading ridges on short length scales can be explained simply as the outcome of reactive porous flow that forms high porosity dissolution channels separated by low porosity inter-channel regions.
To summarize one more time, we think that this relatively simple picture, of high porosity dunite conduits formed by dissolution of pyroxene in olivine saturated, decompressing melt, accounts for most or all constraints on transport of primitive MORB in the melting region beneath mid-ocean ridges.
The End (at last!) Taa Daa
Well, OK, one more point. Hypotheses involving formation of U-series disequilibrium via reactive porous flow require that the porosity be less than or equal to the bulk rock/melt distribution coefficient for the more compatible element in the parent/daughter pair. Using conventional crystal/liquid distribution coefficients, in turn, leads to the conclusion that porosities during formation of 226Ra/230Th excess must be ~ 10-4 during flow of melt in an interconnected grain boundary network, which is theoretically possible (see lecture 1) but perhaps geologically implausible. One way around this possibility would be if trace phases, or even solid grain boundaries, had such large crystal/liquid distribution coefficients that they had a substantial impact on the bulk rock/melt distribution coefficient even though the phases, or grain boundaries, only formed a tiny proportion of the rock. Hiraga et al., Nature 2004, and Hiraga & Kohlstedt, GCA 2007a,b, showed that crystal grain boundaries behave somewhat like equilibrium phases with thermodynamic properties that are distinct from macroscopiccrystals of the same mineral, and have enhanced concentrations of incompatible elements compared to the macroscopic crystals. Here, in a figure from one of the 2007 GCA papers, with dotted horizontal lines Hiraga & Kohlstedt illustrate their predictions for the ratio of the mass of elements on grain boundaries to the total mass of the same elements in a whole rock sample. The mass of each element on the grain boundaries is higher for fine grained rocks (0.1 mm grains) than coarser rocks (1 and 10 mm grains) because the grain boundaries occupy a larger fraction of the total volume in fine grained rocks. Hiraga & Kohlstedt compare their predictions to data from Garrido et al. (EPSL 2000) who sought to determine what proportion of each element was present within macroscopic crystals of olivine, opx, cpx, spinel and garnet in samples from the Ronda peridotite massif in Spain. For the Garrido et al. data, the interface/whole-rock” value is 1-(olivine+opx+cpx+spinel+garnet)/whole rock. In both the predictions of Hiraga & Kohlstedt and the observations of Garrido et al., a large proportion of the highly incompatible elements in the whole rock composition resides on the grain boundaries.
This data set, similar to that of Garrido et al. (EPSL 2000) in the previous slide, is from Bedini & Bodinier, GCA 1999, for mantle xenoliths rather than massif peridotites. For a variety of reasons, these data may be of higher quality than the Garrido et al. data. in two of four peridotites, grain boundaries and the trace phase apatite apparently account for more than 80% of the whole rock budget for U and Th. Some U and Th were probably introduced into the samples from host melt during transport of the xenolith to the surface, and some of this produced new cpx crystals within the xenoliths. Thus, it may be best to use the minimum values for U and Th in the entire data set as upper bounds on the amount of U and Th present in residual olivine, opx, cpx and spinel. In this case, grain boundaries and apatite probably account for more than 90% of the U and Th in the whole rock prior to “impregnation” during transport. The closest proxy in these data sets for Ra is Ba. Grain boundaries and apatite apparently account for more than 90% of the Ba in all four of the whole rock samples. Because Ra is more incompatible than Ba, one can infer that grain boundaries account for more than 95% of the Ra budget in the rock. As a result, the whole rock/melt distribution coefficient for U and Th could be more than five to ten times higher than that calculated using olivine, opx, cpx and spinel distribution distribution coefficients, and the bulk distribution coefficient could be twenty times higher. These data may indicate that grain boundary and trace phase partitioning play an important role in producing observed U-series disequilibrium in MORB.