Download

1 / 54
550 likes | 842 Views
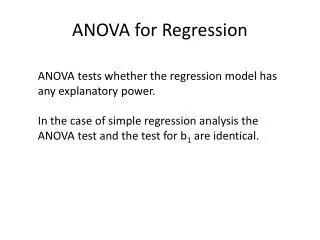
Review of ANOVA and linear regression. Review of simple ANOVA. ANOVA for comparing means between more than 2 groups. Hypotheses of One-Way ANOVA. All population means are equal i.e., no treatment effect (no variation in means among groups) At least one population mean is different

E N D
Hypotheses of One-Way ANOVA • All population means are equal • i.e., no treatment effect (no variation in means among groups) • At least one population mean is different • i.e., there is a treatment effect • Does not mean that all population means are different (some pairs may be the same)
The F-distribution • A ratio of variances follows an F-distribution: • The F-test tests the hypothesis that two variances are equal. • F will be close to 1 if sample variances are equal.
Treatment 1 Treatment 2 Treatment 3 Treatment 4 y11 y21 y31 y41 y12 y22 y32 y42 y13 y23 y33 y43 y14 y24 y34 y44 y15 y25 y35 y45 y16 y26 y36 y46 The group means y17 y27 y37 y47 The (within) group variances y18 y28 y38 y48 y19 y29 y39 y49 y110 y210 y310 y410 How to calculate ANOVA’s by hand… n=10 obs./group k=4 groups
+ + + The (within) group variances Sum of Squares Within (SSW), or Sum of Squares Error (SSE) Sum of Squares Within (SSW) (or SSE, for chance error)
Sum of Squares Between (SSB), or Sum of Squares Regression (SSR) Overall mean of all 40 observations (“grand mean”) Sum of Squares Between (SSB). Variability of the group means compared to the grand mean (the variability due to the treatment).
Total Sum of Squares (SST) Total sum of squares(TSS). Squared difference of every observation from the overall mean. (numerator of variance of Y!)
+ = Partitioning of Variance 10x SSW + SSB = TSS
Mean Sum of Squares F-statistic p-value Source of variation d.f. SSB (sum of squared deviations of group means from grand mean) SSB/k-1 Between (k groups) k-1 Sum of squares nk-k SSW (sum of squared deviations of observations from their group mean) s2=SSW/nk-k Within (n individuals per group) Total variation nk-1 TSS (sum of squared deviations of observations from grand mean) Go to Fk-1,nk-k chart ANOVA Table TSS=SSB + SSW
Treatment 1 Treatment 2 Treatment 3 Treatment 4 60 inches 50 48 47 67 52 49 67 42 43 50 54 67 67 55 67 56 67 56 68 62 59 61 65 64 67 61 65 59 64 60 56 72 63 59 60 71 65 64 65 Example
Treatment 1 Treatment 2 Treatment 3 Treatment 4 60 inches 50 48 47 67 52 49 67 42 43 50 54 67 67 55 67 56 67 56 68 62 59 61 65 64 67 61 65 59 64 60 56 72 63 59 60 71 65 64 65 Example Step 1) calculate the sum of squares between groups: Mean for group 1 = 62.0 Mean for group 2 = 59.7 Mean for group 3 = 56.3 Mean for group 4 = 61.4 Grand mean= 59.85 SSB = [(62-59.85)2 + (59.7-59.85)2 + (56.3-59.85)2 + (61.4-59.85)2 ] xn per group= 19.65x10 = 196.5
Treatment 1 Treatment 2 Treatment 3 Treatment 4 60 inches 50 48 47 67 52 49 67 42 43 50 54 67 67 55 67 56 67 56 68 62 59 61 65 64 67 61 65 59 64 60 56 72 63 59 60 71 65 64 65 Example Step 2) calculate the sum of squares within groups: (60-62) 2+(67-62) 2+ (42-62) 2+ (67-62) 2+ (56-62) 2+ (62-62) 2+ (64-62) 2+ (59-62) 2+ (72-62) 2+ (71-62) 2+ (50-59.7) 2+ (52-59.7) 2+ (43-59.7) 2+67-59.7) 2+ (67-59.7) 2+ (69-59.7) 2…+….(sum of 40 squared deviations) = 2060.6
Source of variation d.f. Between Within Sum of squares Total Mean Sum of Squares F-statistic p-value Step 3) Fill in the ANOVA table 3 196.5 65.5 1.14 .344 36 2060.6 57.2 39 2257.1
Source of variation d.f. Between Within Sum of squares Total Mean Sum of Squares F-statistic p-value Step 3) Fill in the ANOVA table 3 196.5 65.5 1.14 .344 36 2060.6 57.2 39 2257.1 INTERPRETATION of ANOVA: How much of the variance in height is explained by treatment group? R2=“Coefficient of Determination” = SSB/TSS = 196.5/2275.1=9%
Coefficient of Determination The amount of variation in the outcome variable (dependent variable) that is explained by the predictor (independent variable).
S1a, n=25 S2b, n=25 S3c, n=25 P-valued Calcium (mg) Mean 117.8 158.7 206.5 0.000 SDe 62.4 70.5 86.2 Iron (mg) Mean 2.0 2.0 2.0 0.854 SD 0.6 0.6 0.6 Folate (μg) Mean 26.6 38.7 42.6 0.000 SD 13.1 14.5 15.1 Zinc (mg) Mean 1.9 1.5 1.3 0.055 SD 1.0 1.2 0.4 ANOVA example Table 6. Mean micronutrient intake from the school lunch by school a School 1 (most deprived; 40% subsidized lunches).b School 2 (medium deprived; <10% subsidized).c School 3 (least deprived; no subsidization, private school).d ANOVA; significant differences are highlighted in bold (P<0.05). FROM: Gould R, Russell J, Barker ME. School lunch menus and 11 to 12 year old children's food choice in three secondary schools in England-are the nutritional standards being met? Appetite. 2006 Jan;46(1):86-92.
Answer Step 1) calculate the sum of squares between groups: Mean for School 1 = 117.8 Mean for School 2 = 158.7 Mean for School 3 = 206.5 Grand mean: 161 SSB = [(117.8-161)2 + (158.7-161)2 + (206.5-161)2] x25 per group= 98,113
Answer Step 2) calculate the sum of squares within groups: S.D. for S1 = 62.4 S.D. for S2 = 70.5 S.D. for S3 = 86.2 Therefore, sum of squares within is: (24)[ 62.42 + 70.5 2+ 86.22]=391,066
Source of variation d.f. Sum of squares <.05 2 98,113 49056 9 Between Mean Sum of Squares 391,066 5431 Within 72 Total 74 489,179 F-statistic p-value Answer Step 3) Fill in your ANOVA table **R2=98113/489179=20% School explains 20% of the variance in lunchtime calcium intake in these kids.
Beyond one-way ANOVA Often, you may want to test more than 1 treatment. ANOVA can accommodate more than 1 treatment or factor, so long as they are independent. Again, the variation partitions beautifully! TSS = SSB1 + SSB2 + SSW
m B What is “Linear”? • Remember this: • Y=mX+B?
What’s Slope? A slope of 2 means that every 1-unit change in X yields a 2-unit change in Y.
Regression equation… Expected value of y at a given level of x=
Fixed – exactly on the line Follows a normal distribution Predicted value for an individual… yi= + *xi + random errori
Assumptions (or the fine print) • Linear regression assumes that… • 1. The relationship between X and Y is linear • 2. Y is distributed normally at each value of X • 3. The variance of Y at every value of X is the same (homogeneity of variances) • 4. The observations are independent** • **When we talk about repeated measures starting next week, we will violate this assumption and hence need more sophisticated regression models!
Sy/x Sy/x Sy/x Sy/x Sy/x Sy/x The standard error of Y given X is the average variability around the regression line at any given value of X. It is assumed to be equal at all values of X.
A2 B2 C2 yi C A SStotal Total squared distance of observations from naïve mean of y Total variation SSreg Distance from regression line to naïve mean of y Variability due to x (regression) SSresidual Variance around the regression line Additional variability not explained by x—what least squares method aims to minimize B B y A C yi x Regression Picture *Least squares estimation gave us the line (β) that minimized C2 R2=SSreg/SStotal
Recall example: cognitive function and vitamin D • Hypothetical data loosely based on [1]; cross-sectional study of 100 middle-aged and older European men. • Cognitive function is measured by the Digit Symbol Substitution Test (DSST). 1. Lee DM, Tajar A, Ulubaev A, et al. Association between 25-hydroxyvitamin D levels and cognitive performance in middle-aged and older European men. J Neurol Neurosurg Psychiatry. 2009 Jul;80(7):722-9.
Distribution of vitamin D Mean= 63 nmol/L Standard deviation = 33 nmol/L
Distribution of DSST Normally distributed Mean = 28 points Standard deviation = 10 points
Four hypothetical datasets • I generated four hypothetical datasets, with increasing TRUE slopes (between vit D and DSST): • 0 • 0.5 points per 10 nmol/L • 1.0 points per 10 nmol/L • 1.5 points per 10 nmol/L
The “Best fit” line Regression equation: E(Yi) = 28 + 0*vit Di (in 10 nmol/L)
The “Best fit” line Note how the line is a little deceptive; it draws your eye, making the relationship appear stronger than it really is! Regression equation: E(Yi) = 26 + 0.5*vit Di (in 10 nmol/L)
The “Best fit” line Regression equation: E(Yi) = 22 + 1.0*vit Di (in 10 nmol/L)
The “Best fit” line Regression equation: E(Yi) = 20 + 1.5*vit Di (in 10 nmol/L) Note: all the lines go through the point (63, 28)!
Tn-2= Significance testing… Slope Distribution of slope ~ Tn-2(β,s.e.( )) H0: β1 = 0 (no linear relationship) H1: β1 0 (linear relationship does exist)
Example: dataset 4 • Standard error (beta) = 0.03 • T98 = 0.15/0.03 = 5, p<.0001 • 95% Confidence interval = 0.09 to 0.21
Multiple linear regression… • What if age is a confounder here? • Older men have lower vitamin D • Older men have poorer cognition • “Adjust” for age by putting age in the model: • DSST score = intercept + slope1xvitamin D + slope2 xage
Fit a plane rather than a line… On the plane, the slope for vitamin D is the same at every age; thus, the slope for vitamin D represents the effect of vitamin D when age is held constant.
Equation of the “Best fit” plane… • DSST score = 53 + 0.0039xvitamin D (in 10 nmol/L) - 0.46 xage (in years) • P-value for vitamin D >>.05 • P-value for age <.0001 • Thus, relationship with vitamin D was due to confounding by age!
Multiple Linear Regression • More than one predictor… E(y)= + 1*X + 2*W + 3 *Z… Each regression coefficient is the amount of change in the outcome variable that would be expected per one-unit change of the predictor, if all other variables in the model were held constant.