Download
1 / 21
210 likes | 362 Views
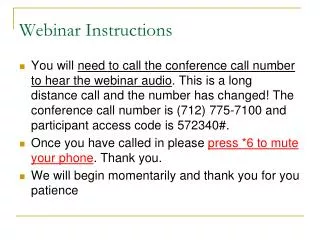
Welcome to the latest NRS Webinar: Teacher-level Carousel Exercise!. We will begin promptly at 2 pm EST. Helpful Hints: *6 will mute your phone *7 will unmute your phone To view full screen, click “View: Full Screen. Press the “Esc” key to return to normal view.

E N D
Welcome to the latest NRS Webinar: Teacher-level Carousel Exercise! We will begin promptly at 2 pm EST. Helpful Hints: • *6 will mute your phone • *7 will unmute your phone • To view full screen, click “View: Full Screen. Press the “Esc” key to return to normal view. • Don’t forget to fill out our post-webinar survey!
Teacher-level Carousel Exercise NRS Webinar - January 2007 AIR Staff: Natalia Pane
Today • Background (3 min) • Walk through Excel file (10 min) • Web resource review (2 min) • Open for comments, ideas, others’ experiences (10 min?) • Close
Background • Summer 2006 Data Detective Trainings’ Data Carousel exercise • Poster-size charts of data from 5 sites showing: • Completion rates three-year trend • Completion rates by level • Numbers with both pre and post tests • Timing of tests • Efficiency (cost per outcome)
Background • Part 1: • Participants divided into 5 groups • Each begins at one wall chart • Write observations, possible causes, and next steps • Spend 3 minutes per graph • Cycle to next graph • When return to first graph, report observations on that graph to the group
Background • Part 2: • Each group assigned one site (e.g., Holmestead) • Review each graph again, but focus on this site • Report out story of this site • Detailed in facilitators’ notes • Questions?
Why new? • People requested • Teacher/class level • More data!
Teacher-level carousel exercise (Excel file sent early this week) • Tabs: • Contents • Blue tabs: Class comparisons (same level) • Green tabs: Sam Spade’s class only • Yellow tabs: Student-level data by class (not comprehensive)
Teacher-level carousel exercise Classes named for teachers: • Sam Spade • Kay Scarpetta • Philip Marlowe • Jessica Fletcher • Gil Grissom
Teacher-level carousel exercise Excel file walk through….
Teacher-level carousel exercise Additional files: • Wall chart MS Word file • Handouts MS Word file
Teacher-level carousel exercise • Options for exercises: • Repeat process from summer training using blue tabs (compare classes) • Use only green tabs; repeat process for Part 1, then Part 2 all tell the story of the Spade classroom by looking across the graphs • Classroom data supports further inquiry
Website resources http://www.nrsweb.org/trainings/events/2006smmr.aspx • Summer 2006 Data Detective Training Carousel exercise • Excel file • Handouts • Facilitators’ notes • Teacher-level • Excel file • Handouts • Wall charts
Next Steps • Note: Exercises NOT pilot tested! • Modify and share with us! • Other examples you developed?
Open mic • Thoughts? • Comments? • Questions? • Suggestions? • Experiences? • Other tools developed by you/your state?