Download

1 / 19
190 likes | 319 Views
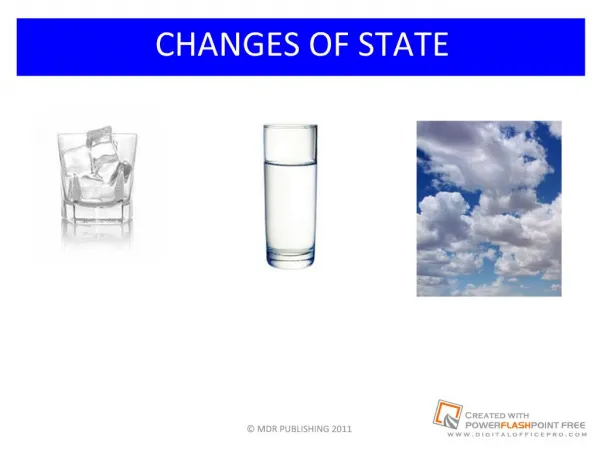
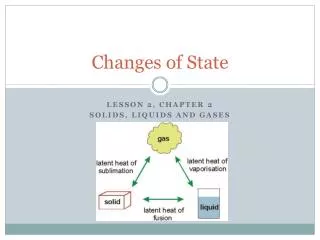
Changes of State. Melting point. As the temp of the solid is increased, a point is eventually reached where the liquid and solid have identical vapor pressures. Vapor pressure of solid and liquid water as a function of temperature. Normal melting pt.

E N D
Melting point • As the temp of the solid is increased, a point is eventually reached where the liquid and solid have identical vapor pressures
Vapor pressure of solid and liquid water as a function of temperature
Normal melting pt • The temp at which the solid and liquid states have the same vp under the conditions where the total pressure is 1 atm
Normal boiling pt • Temperature at which the vp of the liquid is exactly 1 atm • boiling occurs when the vp of the liq is equal to the pressure of its environment
Phase Diagrams • Represent the phases of a substance as a function of temperature and pressure
Phase Diagrams • Shows which state can exist at given temp and pressure • conditions of CLOSED system
Critical temp • temp above which vapor cannot be liquified no matter what pressure is applied
Critical Pressure • Pressure required to produce liquification at the critical temp
Critical point • Defined by critical pressure and temp (374oC, 218 atm) • beyond this point is intermediate “fluid” region
Phase diagram for water • Solid/liquid line has negative slope • mp of water decreases as external pressure increases
Phase diagram for water • Opposite of most substance b/c density of ice less than water at mp
Phase diagram for CO2 • Solid/liquid line has positive slope • solid CO2 is more dense than liquid CO2
Phase diagram for CO2 • Triple point at 5.1 atm and -56.6oC • Critical point at 72.8 atm and 31oC • at 1 atm CO2 sublimes