Download
1 / 24
270 likes | 559 Views
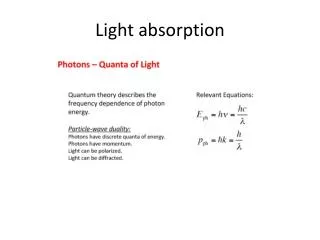
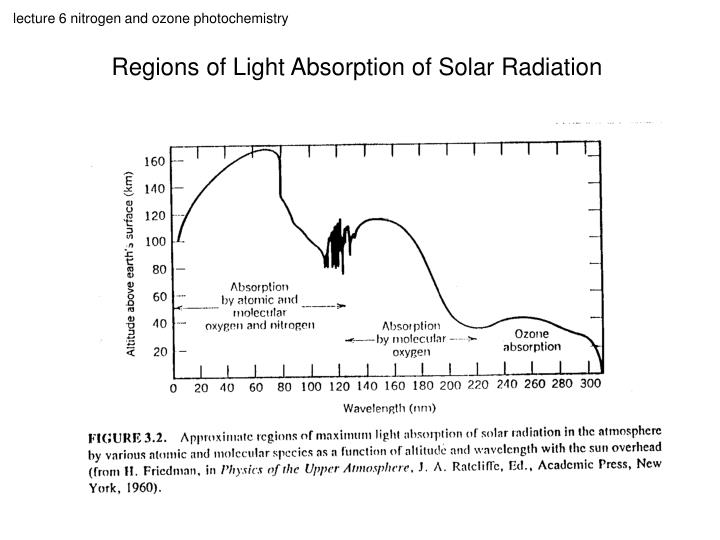
Regions of Light Absorption of Solar Radiation. Absorption by Small Molecules. Small, light chemical species (N 2 and H 2 ) generally absorb via electronic excitation at shorter wavelengths ( l <~ 100 nm) than more complex compounds.

E N D
Absorption by Small Molecules Small, light chemical species (N2 and H2) generally absorb via electronic excitation at shorter wavelengths (l <~ 100 nm) than more complex compounds. As symmetric linear diatomic molecules, they also do not absorb much IR radiation (cannot induce a dipole moment by vibration or rotation – no dipole allowed transitions). Most of their influence is in the upper atmosphere.
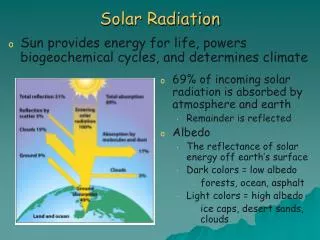
N2 Absorption Regions • ionization continuum: < 800 Å • Tanaka-Worley bands: 800-1000 Å • Lyman-Birge-Hopfield bands: 1000-1450 Å
Nitrogen Photochemistry Light absorption begins at 120 nm Dissociation: N2+hn(80<l<91nm) 2N.(N(4S) + N(2D)) Ionization: N2+hn (l<80nm) N2+ + e- At 91nm s=4x10-20 cm2 The atmospheric absorption of a layer 1 km deep is: Beer-Lambert law: I = I0exp(-n s z) Why can we use this? D = ln(I0/I) = n s z =(9x10¹²)(4x10-20)(1x10⁵) = 0.036 I/I0 = 0.92; T = 0.92; A=1-T = 0.08 T: transmission A: absorption Result: 8% of the light is absorbed by the 1km layer at 100km
Ozone Absorption • mixing ratio: ~0.3 ppm • only absorber to absorb damaging radiation at 230-290 nm • high absorption cross section at 230-290 nm
Ozone Photochemistry O-O2 is very weak Minimal dissociation energy (l=1180nm) O3+hn(l<1180nm) O(3P)+O2 Light absorption: At 250nm s=10-17cm2 The atmospheric depth of O3 is equivalent to 0.3 cm at STP: D{250nm]=10-17x0.3x2.7x1019=81; T=10-D=10-81
Energy Level Diagrams for Polyatomic Molecules Instead of potential energy curves, in triatomic systems have potential energy surfaces, since need to represent three distances: With more than three atoms have a multi-dimensional potential energy hypersurfaces.
Energy Levels of Polyatomic Molecules Although the energy level diagrams are more complicated, the same types of transitions can occur: • Allowed Transitions/Optical Dissociation: The molecule jumps to higher vibrational states and eventually to dissociation within the same electronic energy state. • Forbidden Transitions • Pre-Dissociation: The molecule jumps from its ground electronic energy state to a higher electronic energy state, followed by intramolecular energy transfer to the energy level of dissociation into two ground state species.
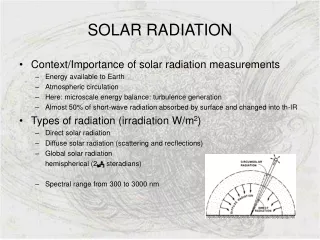
Ozone Absorption Spectrum – Chappuis Band Chappuis Band
Explanation of Ozone Absorption Regions • Hartley band: spin allowed transitions • Huggins and Chappuis bands: spin forbidden transitions (weaker)
Ozone Dissociation Products • Depending on photon energy, the dissociation products O and O2 can be in excited states. • According to spin conservation, allowed transitions have O and O2 both as singlets (2S+1 = 1) or both as triplets (2S+1 = 3). • Lowest energy singlet pair: O(1D) and O2(1Dg) What is the threshold for allowed O(1D) production?
Ozone Dissociation Products cont. O3+hn(l<X nm) O(tY)+O2(aL)
Ozone Dissociation Products cont. What is the threshold for allowed O(1D) production? ~310 nm However, O3+hn(l < 411 nm)O(1D) + O2(3S) is also an important source of O(1D). Why? How does the reaction occur?
Why is the Quantum Yield Not a Step Function? Energy in internal vibrations and rotations can assist dissociation. Quantum yield depends on temperature as well.
O(1D) Reactions The most reactive atmospheric reagent (chicken and egg story): Selective reactions O(1D) + H2O 2HO. O(1D) H2 HO + H. O(1D) + N2O 2NO O(1D) + CFC’s Products Also O(1D) + N2 O(3P)+ N2 In fact: O(1D) + M O(3P) + M
O(1D) Lifetime Formation O2+hn (l<175nm) O(1D)+O(3P) J{O2} O3+hn (l<410nm) O(1D)+O(3S) J{O3} Removal O(1D) + N2 O(3P)+ N2 k3=5.4x10⁻¹¹ O(1D) + O2 O(3P) + O2 k4=7.4x10⁻¹¹ [O(1D)]ss=(J{O2}+J{O3})/(k3[N2 ]+k4[O2]) t=1/(k3[N2 ]+k4[O2])
Reactivity and Electronic State Why is O(1D) more reactive than O(3P)? • energy: excitation energy contributes to energy of reaction (reaction may switch from endothermic to exothermic) • kinetics: the dependence of reaction rates on temperature can often be written exp(-Ea/RT): Arrhenius expression R: universal gas constant Ea: activation energy excitation energy reduces Ea • electronic configuration: different electron arrangement may favor reaction by making it easier to conserve spin angular momentum
Another Example of an Excited State Reaction Excited state of N2: N2* + O2 N2O + O Source of N2O at altitudes above 20 km