Download
1 / 1
10 likes | 138 Views
Policy Choice: Forest or Fuel?. Keith Sargent, Ph.D. and Clay Ogg, Ph.D. U.S. EPA, OA/OPEI-NCEE, Washington, DC*.

E N D
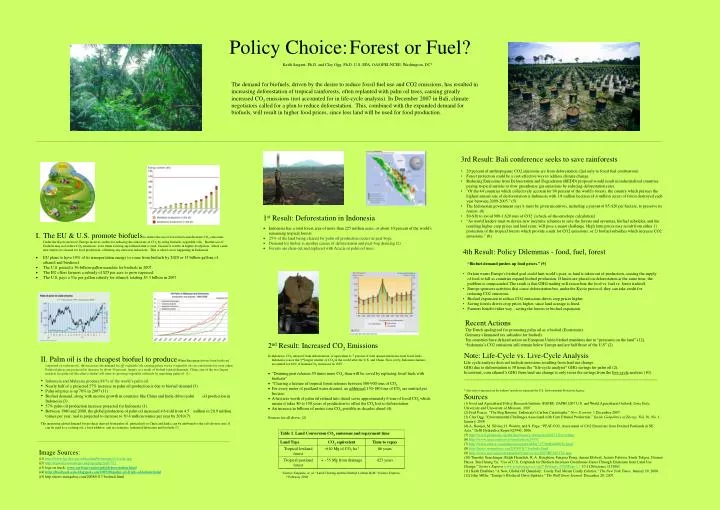
Policy Choice: Forest or Fuel? Keith Sargent, Ph.D. and Clay Ogg, Ph.D. U.S. EPA, OA/OPEI-NCEE, Washington, DC* The demand for biofuels, driven by the desire to reduce fossil fuel use and CO2 emissions, has resulted in increasing deforestation of tropical rainforests, often replanted with palm oil trees, causing greatly increased CO2 emissions (not accounted for in life-cycle analysis). In December 2007 in Bali, climate negotiators called for a plan to reduce deforestation. This, combined with the expanded demand for biofuels, will result in higher food prices, since less land will be used for food production. • 3rd Result: Bali conference seeks to save rainforests • 20 percent of anthropogenic CO2 emissions are from deforestation (2nd only to fossil fuel combustion). • Forest protection could be a cost-effective way to address climate change. • Reducing Emissions from Deforestation and Degradation (REDD) proposal would result in industrialized countries paying tropical nations to slow greenhouse gas emissions by reducing deforestation rates. • "Of the 44 countries which collectively account for 90 percent of the world's forests, the country which pursues the highest annual rate of desforestation is Indonesia with 1.8 million hectares (4.4 million acres) of forest destroyed each year between 2000-2005." (5) • The Indonesian government says it must be given incentives, including a payout of $5-$20 per hectare, to preserve its forests. (6) • $9-$36 to avoid 900-1,620 tons of CO2 [a back-of-the-envelope calculation] • “As world leaders meet to devise new incentive schemes to save the forests and savannas, biofuel subsidies, and the resulting higher crop prices and land rents, will pose a major challenge. High farm prices may result from either 1) protection of the tropical forests which provide a sink for CO2 emissions, or 2) biofuel subsidies which increase CO2 emissions.” (8) • 1st Result: Deforestation in Indonesia • Indonesia has a total forest area of more than 225 million acres, or about 10 percent of the world's remaining tropical forests • 25% of the land being cleared for palm oil production occurs in peat bogs. • Demand for timber is another causes of deforestation and peat-bog draining (2) • Forests are clear-cut and replaced with Acacia or palm oil trees. • The EU & U.S. promote biofuelsto reduce the use of fossil fuels and decrease CO2 emissions. Under the Kyoto protocol, Europe receives credits for reducing the emissions of CO2 by using biofuels (vegetable oils). But the use of biofuels may not reduce CO2 emissions, even when existing agricultural land is used, because it results in higher food prices, which cause new land to be cleared for food production, offsetting any emission reductions. This is what is now happening in Indonesia. • EU plans to have 10% of its transportation energy to come from biofuels by 2020 or 15 billion gallons of ethanol and biodiesel. • The U.S. passed a 36-billion-gallon mandate for biofuels in 2007. • The EU offers farmers a subsidy of $25 per acre to grow rapeseed. • The U.S. pays a 51¢ per gallon subsidy for ethanol, totaling $3.3 billion in 2007 • 4th Result: Policy Dilemmas - food, fuel, forest • “Biofuel demand pushes up food prices.” (9) • Oxfam warns Europe's biofuel goal could hurt world's poor, as land is taken out of production, causing the supply of food to fall as countries expand biofuel production. If limits are placed on deforestation at the same time, the problem is compounded. The result is that GHG trading will exacerbate the food vs. fuel vs. forest tradeoff. • Europe sponsors activities that cause deforestation but, under the Kyoto protocol, they can take credit for reducing CO2 emissions. • Biofuel expansion to reduce CO2 emissions drives crop prices higher. • Saving forests drives crop prices higher, since land acreage is fixed. • Farmers benefit either way - saving the forests or biofuel expansion. Recent Actions The Dutch apologized for promoting palm oil as a biofuel (Economist). Germany eliminated tax subsidies for biofuels. Ten countries have delayed action on European Union biofuel mandates due to “pressures on the land” (12). “Indonesia’s CO2 emissions still remain below Europe and are half those of the U.S” (2) • 2nd Result: Increased CO2 Emissions • In Indonesia, CO2 released from deforestation, is equivalent to 7 percent of total annual emissions from fossil fuels. Indonesia is now the 3rd largest emitter of CO2 in the world after the U.S. and China. Fires set by Indonesia farmers accounted for 40% of human CO2 emissions in 1997. • “Draining peat releases 30 times more CO2 than will be saved by replacing fossil fuels with biofuels” • “Clearing a hectare of tropical forest releases between 500-900 tons of CO2 • For every meter of peatland water drained, an additional 130-180 tons of CO2 are emitted per hectare. • A hectares worth of palm oil refined into diesel saves approximately 6 tons of fossil CO2 which means it takes 80 to 150 years of production to offset the CO2 lost to deforestation. • An increase in billions of metric tons CO2 possible in decades ahead (4). • Sources for all above: (2) Note: Life-Cycle vs. Live-Cycle Analysis Life cycle analysis does not include emissions resulting from land use change. GHG due to deforestation is 30 times the “life-cycle analysis” GHG savings for palm oil (2). In contrast, corn ethanol’s GHG from land use change is only twice the savings from the live-cycle analysis (10). • II. Palm oil is the cheapest biofuel to produceWhen European drivers burn biodiesel (rapeseed or soybean oil), this increases the demand for all vegetable oils causing prices to rise (vegetable oils are substitutes for each other). Palm oil prices are projected to increase by about 50 percent, largely as a result of biofuel-related demands. China, one of the two largest markets for palm oil (the other is India) will meet its growing vegetable oil needs by importing palm oil. (1). • Indonesia and Malaysia produce 88 % of the world’s palm oil. • Nearly half of a projected 57% increase in palm oil production is due to biofuel demand (3) • Palm oil price is up 70% in 2007 (11). • Biofuel demand, along with income growth in countries like China and India drives palm oil production in Indonesia (3). • 57% palm oil production increase projected for Indonesia (1). • Between 1980 and 2000, the global production of palm oil increased 4.6-fold from 4.5 million to 20.9 million tonnes per year, and is projected to increase to 30.4 million tonnes per year by 2010(7) • The increasing global demand for products derived from palm oil, particularly in China and India, can be attributed to the oil's diverse uses. It can be used as a cooking oil, a food additive, and in cosmetics, industrial lubricants and biofuels(7) * Any views expressed are the authors’ and do not represent the U.S. Environmental Protection Agency. Sources (1) Food and Agricultural Policy Research Institute (FAPRI). FAPRI 2007 U.S. and World Agricultural Outlook. Iowa State University and University of Missouri, 2007. (2) Fred Pearce. “The Bog Barrons: Indonesia’s Carbon Catastrophe.” New Scientist. 1 December 2007. (3) Clay Ogg. “Environmental Challenges Associated with Corn Ethanol Production.” Inside Geopolitics of Energy. Vol. 30, No. 1, January, 2008. (4) A. Hooijer, M. Silvius, H. Wosten, and S. Page. “PEAT-CO2, Assessment of CO2 Emissions from Drained Peatlands in SE Asia.” Delft Hydraulics Report Q3943, 2006. (5) http://www.planetark.org/dailynewsstory.cfm/newsid/41711/story.htm (6) http://www.enn.com/ecosystems/article/24351 (7) http://www.nature.com/nature/journal/v448/n7157/full/448993a.html (8) http://news.mongabay.com/2008/0117-biofuels.html (9) http://www.imf.org/external/pubs/ft/survey/so/2007/RES1017A.htm (10) Timothy Searchinger, Ralph Heimlich, R. A. Houghton, Fengxia Dong, Amani Elobeid, Jacinto Fabiosa, Simla Tokgoz, Dermot Hayes, Tun-Hsiang Yu. “Use of U.S. Croplands for Biofuels Increases Greenhouse Gases Through Emissions from Land Use Change.” Science Expresswww.scienceexpress.org/7 February 2008/Page 1 / 10.1126/science.1151861 (11) Keith Bradsher. “A New, Global Oil Quandary: Costly Fuel Means Costly Calories.” The New York Times, January 19, 2008. (12) John Miller. “Europe’s Biodiesel Drive Sputters.” The Wall Street Journal. December 28, 2007. Image Sources: (i1) http://www.jgi.doe.gov/education/bioenergy/co2cycle.jpg (i2) http://epaedia.eea.europa.eu/page.php?pid=551 (i3) logs on truck: www.carboncounter.info/deforestation.html (i4)http://biodiesel-asia.blogspot.com/2007/08/palm-oil-fruits-of-labour.html (i5) http://news.mongabay.com/2008/0117-biofuels.html Source: Fargione, et. al. “Land Clearing and the Biofuel Carbon Debt” Science Express, 7 February 2008