Download
1 / 18
190 likes | 488 Views
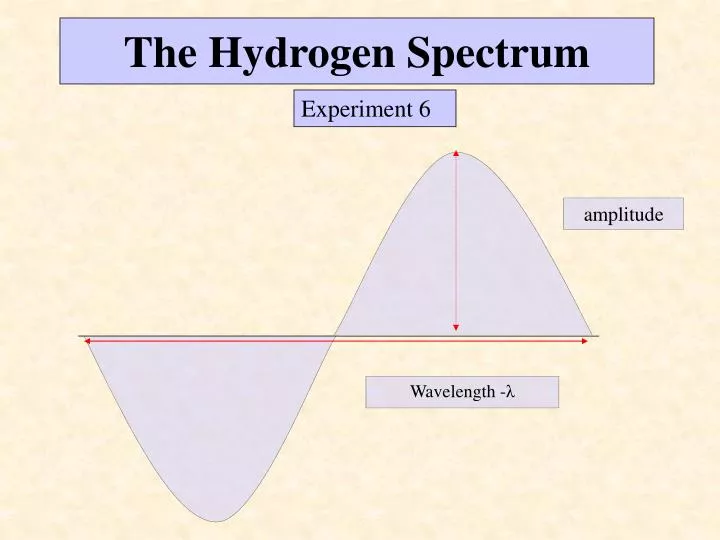
The Hydrogen Spectrum. Experiment 6. amplitude. Wavelength - λ. Introduction. Purpose : To observe the spectra of elements and relate the wavelengths to energy and energy levels of electrons. Spectroscope : Spectra – color, scope inspect thus inspect colors.

E N D
The Hydrogen Spectrum Experiment 6 amplitude Wavelength -λ
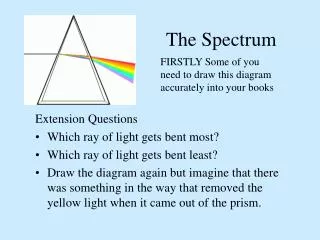
Introduction • Purpose: To observe the spectra of elements and relate the wavelengths to energy and energy levels of electrons. • Spectroscope: Spectra – color, scope inspect thus inspect colors. • Contains a prism, which separates emitted light into its constituent wavelengths. (red, green…etc.)
Light • Light: Electromagnetic energy (or combination of electric and magnetic fields) – can be described by frequency and wavelength. • Wavelength () – distance between two peaks • Frequency () – Cycles (Wavelengths) per second. amplitude Wavelength -
Electron Trends • Electrons want to be as stable as possible, so initially they are in the lowest energy level possible. • When electrons are heated they absorb energy. They travel to a higher energy level, and are now less stable. • Electrons will release energy (light) to become more stable. • An element when heated to its gaseous state, produces an emission line spectrum which we can observe by using a spectroscope. (Finger print)
Cl Bohr’s Theory diagram of a Cl atom • Electrons revolve around the nucleus in specific energy levels called orbits. • Principle energy level (n): 1, 2, 3, ……n • The greater the value of n the further away from the nucleus the electron is. Nucleus
Light emitted from hydrogen atom. We will observe energy being emitted as electrons drop from higher energy levels to lower ones. • Electrons that fall to the 2nd energy level can been seen by us. !!Light is the disposal of energy!! 6 5 4 n= IR 3 visible 2 1 UV
The Equation for Lightc= * • Speed of light (c) in a vacuum – 3.0 x 10⁸ m/s • This in an inversely proportional relationship. • If the wavelength increases, the frequency decreases. • Note: 1 nm = 10-9 m!!!
Since energy emitted depends on the size of the energy level drop, atoms may emit visible or non-visible light. • Note: For hydrogen, each electron drop to n = 2 will result in the emission of visible light. • nf will be 2 for our experiment.
Calculating Energy • The energy evolved (absorbed or emitted) from an electrons transition is called a photon (discrete packet of energy). • E = h • Where h = 6.63 x 10⁻³⁴ J•s (Planck’s constant), and = frequency (sec-1or s-1) • NOTE: E Negative value during emission E Positive value during absorption
A Sample Calculation Part #1 • A Hydrogen spectral line is observed at 486 nm. Find , and E, • = c/ • You must first convert nanometers to meters Where 1nm = 10-9 m • 486nm = 4.86 x 10⁻⁷ m • c = 3.0 x 10⁸ m/s
Rydberg’s Equation Nf will be 2 for our experiment! • We can determine initial and final location of an electron, or a change in energy. • Relates energy emitted to an electron shift. • E Energy emitted, Joules • Rh 2.18 x 10⁻¹⁸ Joules • Ni Initial energy level • Nf Final energy level
Determine the change in energy Given: Ni = 4 Nf = 2 Rh = 2.18 x 10⁻¹⁸ J Rydberg’s Equation
75 Today in Lab Part # 1- We will use a optical bench to determine the wavelength We will measure the distance between the source and location of the light. The source is directly behind 50 cm on the meter stick We will ignore the left of the stick Our measurement will be from the source to the location of the light. Example light is visible at 75 cm so the distance is 75- 50 or 25cm. 50 60 70
How to determine Wavelength λ= wavelength X= distance from light to line ( in cm) D= diffraction grating. = (1667 nm) L = length of bar distance from grating to source (100 cm)
D = 1667 nm L = 100 cm X = 25cm λ 416.75nm Wavelength Example
Pages 83, 86-87 Use Literature values for λ not calculated values. Ignore sections 2 & 3 pgs86-7 determine the needed information for each specific color Ignore section C pg 87
Due Next Lab • pg83 # 1 Flame test Demo, # 2 Visible Spectrum • pgs 85-87 4A-4C • Section C pg 87 identify unknown element Show all calculations for full credit